Distribution of Event Vehicles by Nation
Have you ever wondered which nations dominate War Thunder events, or how Battle Pass vehicles are spread out across the different nations and ranks? Which countries get the “juiciest” vehicles in Battle Passes, and which are mostly stuck with the smaller or older rewards?
Inspired by @Bruce_R1 's Data Analysis series, I dived into War Thunder event vehicles to know more about their distribution, I analysed all vehicles available through Battle Passes, seasonal events, and other special events which occured from the start of War Thunder until the 31st of December 2025 (this includes vehicles given as throphies for tournaments and Cups, even though they were only availabe to a select few elite players). Most of this information was aquired through the War Thunder wiki, whilst checking data against @_Poul 's vehicle data used for How the total vehicle costs have changed in War Thunder (2020–2025).
Vehicles by Rank
The rank of an event vehicle holds a lot of meaning in regards to events, they are what determine the cost of tasks or the amount of marks of distinction needed to recieve them and in recent events also the cost of the coupon to make them sellable on the marketplace. A low rank, like Rank I or II also determine if you’ll be able to do Special Tasks and Daily Tasks with them. And finally they also determine how far along the Ranks of a Tech tree you’ll be able to research (depending on if they are premium or not).
The table below shows vehicle distribution by nation and rank. I’ve included all event vehicles, which highlights how each nation’s vehicles are spread across tiers:
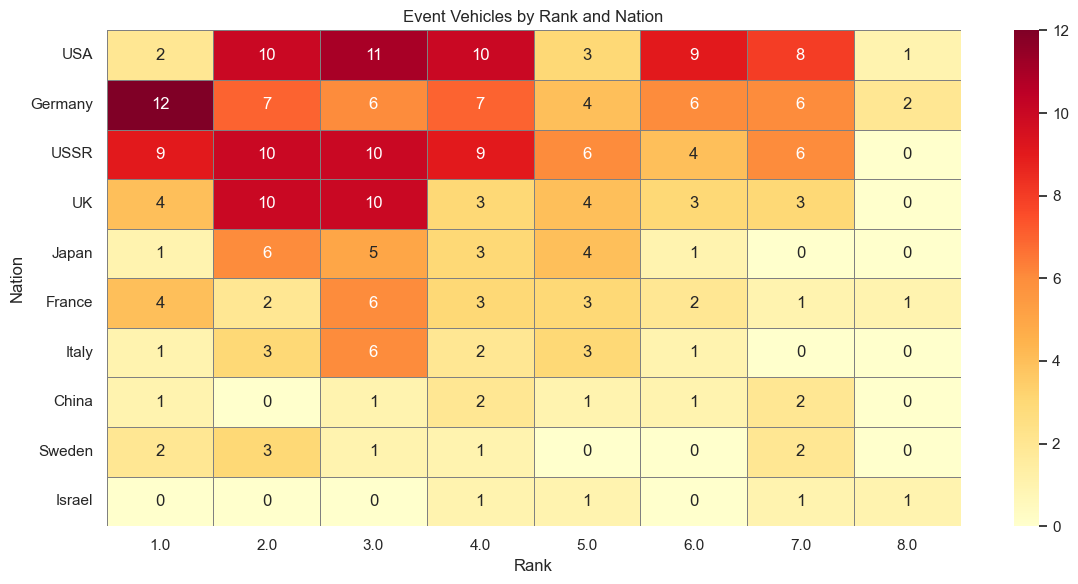
Table of Vehicles by Nation and Rank
| Nation (below) - Rank (right) | 1 | 2 | 3 | 4 | 5 | 6 | 7 | 8 |
|---|---|---|---|---|---|---|---|---|
| USA | 2 | 10 | 11 | 10 | 3 | 9 | 8 | 1 |
| Germany | 12 | 7 | 6 | 7 | 4 | 6 | 6 | 2 |
| USSR | 9 | 10 | 10 | 9 | 6 | 4 | 6 | 0 |
| UK | 4 | 10 | 10 | 3 | 4 | 3 | 3 | 0 |
| Japan | 1 | 6 | 5 | 3 | 4 | 1 | 0 | 0 |
| France | 4 | 2 | 6 | 3 | 3 | 2 | 1 | 1 |
| Italy | 1 | 3 | 6 | 2 | 3 | 1 | 0 | 0 |
| China | 1 | 0 | 1 | 2 | 1 | 1 | 2 | 0 |
| Sweden | 2 | 3 | 1 | 1 | 0 | 0 | 2 | 0 |
| Israel | 0 | 0 | 0 | 1 | 1 | 0 | 1 | 1 |
A few observations from the rank table:
- The USA and USSR dominate mid-tier ranks (2–4), which suggests these nations are heavily represented in the “bread and butter” of event content.
- Germany and the UK show a more even distribution across ranks 2–7, with Germany heavily represented in rank 1 vehicles, which is a legacy of the first styles of events, where low rank (1-2) vehicles were prevalent as a first vehicle before the main reward.
These four Nations are the oldest in the game (with Japan recieving their Ground tree much later), and were historically far more likely to get one or several low-rank (1-3) vehicles in the first stage of an event. Japan, however, recieved comparably only little event vehicles, much like the later added Italy.
-
Smaller nations, such as Israel, Sweden and China, appear in limited numbers but are surprisingly well-distributed across several ranks, meaning that even rare nations get representation in mid- to high-tier content, although with the low number of event vehicles there are hardly any conclusions that can be made.
-
High-rank vehicles (7–8) are mostly concentrated in the USA, Germany, and USSR, indicating that premium and late-game content is dominated by the major powers. Considering that a lot of these high rank vehicles are recent additions, it’s fair to say that in regular events these nations have been overrepresented. Like can be seen in the next part.
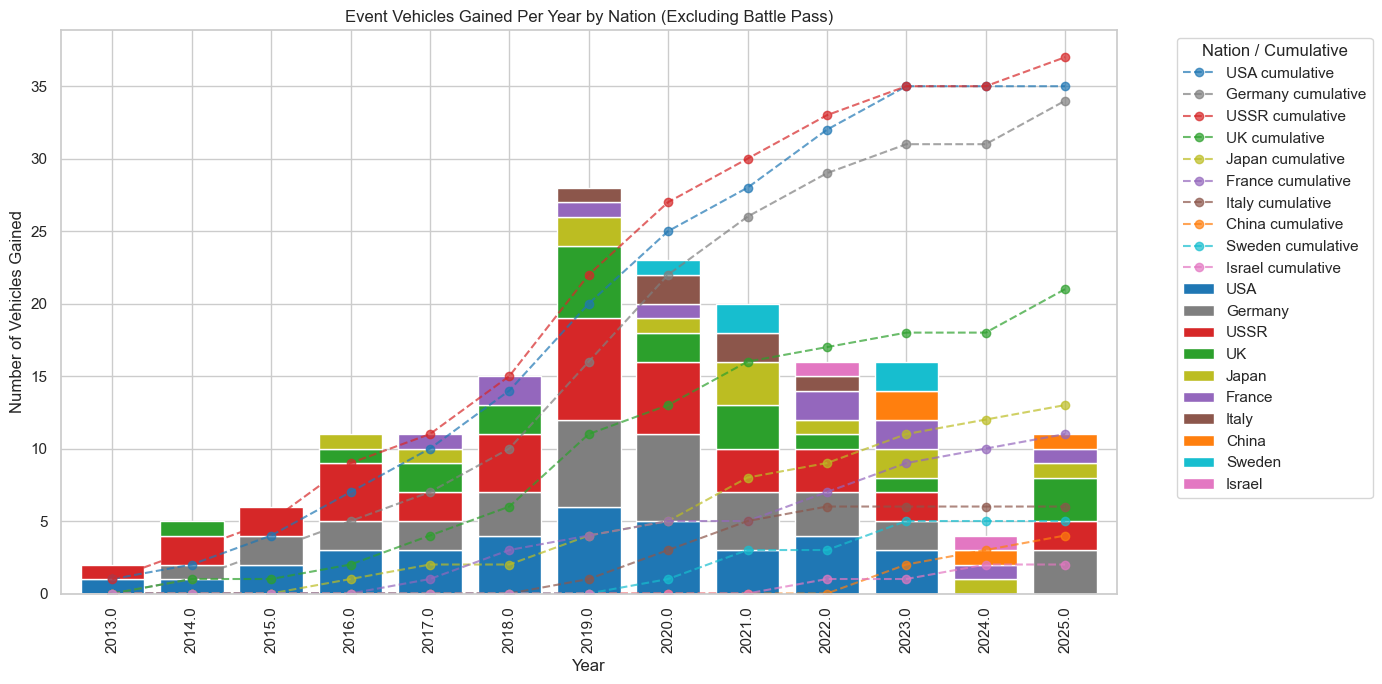
Overall Event Vehicle Distribution
Here’s a breakdown of all event vehicles, including Battle Pass, seasonal, and other events:

Spoiler
| Nation | Vehicles | Proportion (%) |
|---|---|---|
| USA | 54 | 19.7 |
| USSR | 54 | 19.7 |
| Germany | 50 | 18.2 |
| UK | 37 | 13.5 |
| France | 22 | 8.0 |
| Japan | 20 | 7.3 |
| Italy | 16 | 5.8 |
| Sweden | 9 | 3.3 |
| China | 8 | 2.9 |
| Israel | 4 | 1.5 |
Some insights:
- The USA and USSR together account for nearly 40% of all event vehicles, reinforcing their status as the most represented nations.
- Germany is not far behind, followed by the UK. These four nations make up the bulk of all content.
- Smaller nations (Israel, China, Sweden) appear relatively rarely, but they are still represented enough to make some events unique.
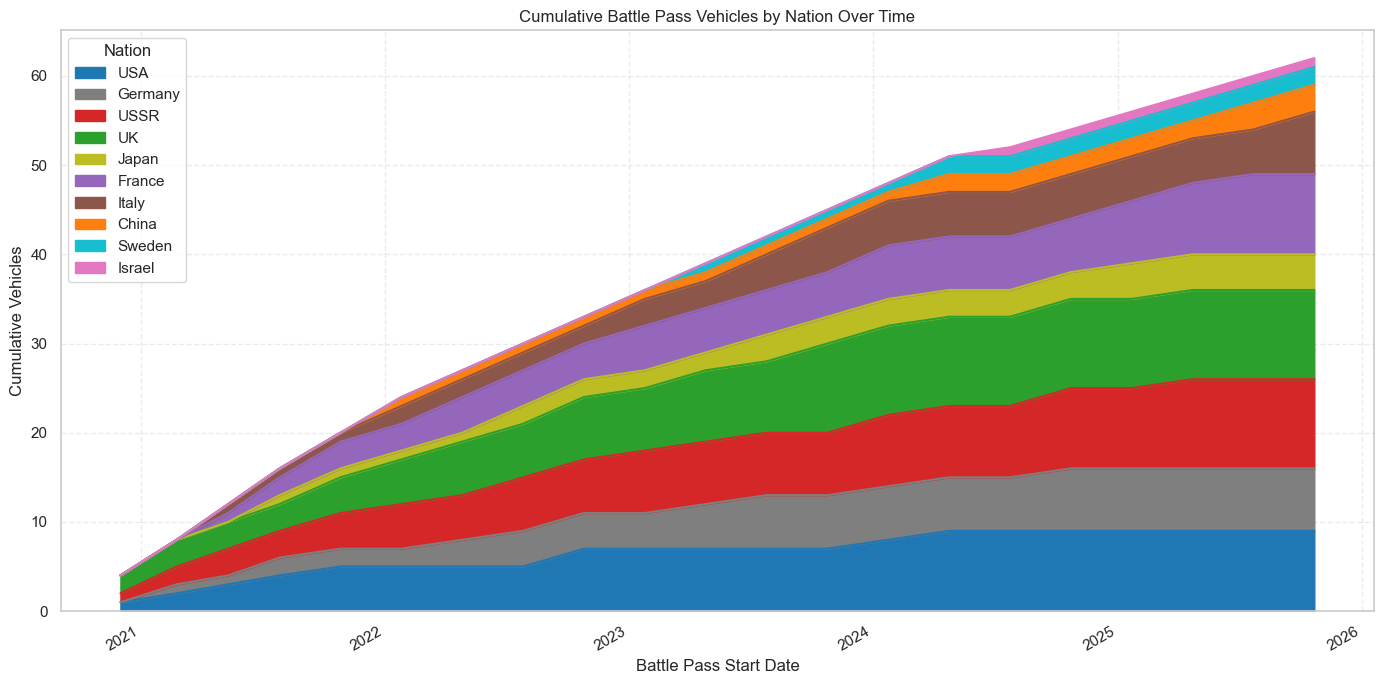
Battle Pass Vehicles
Battle Passes were added as an alternative way to add more event vehicles in the game. Broken out by nationality, this is what the proportions of Battle Pass vehicles compared to the total event vehicles looks like:
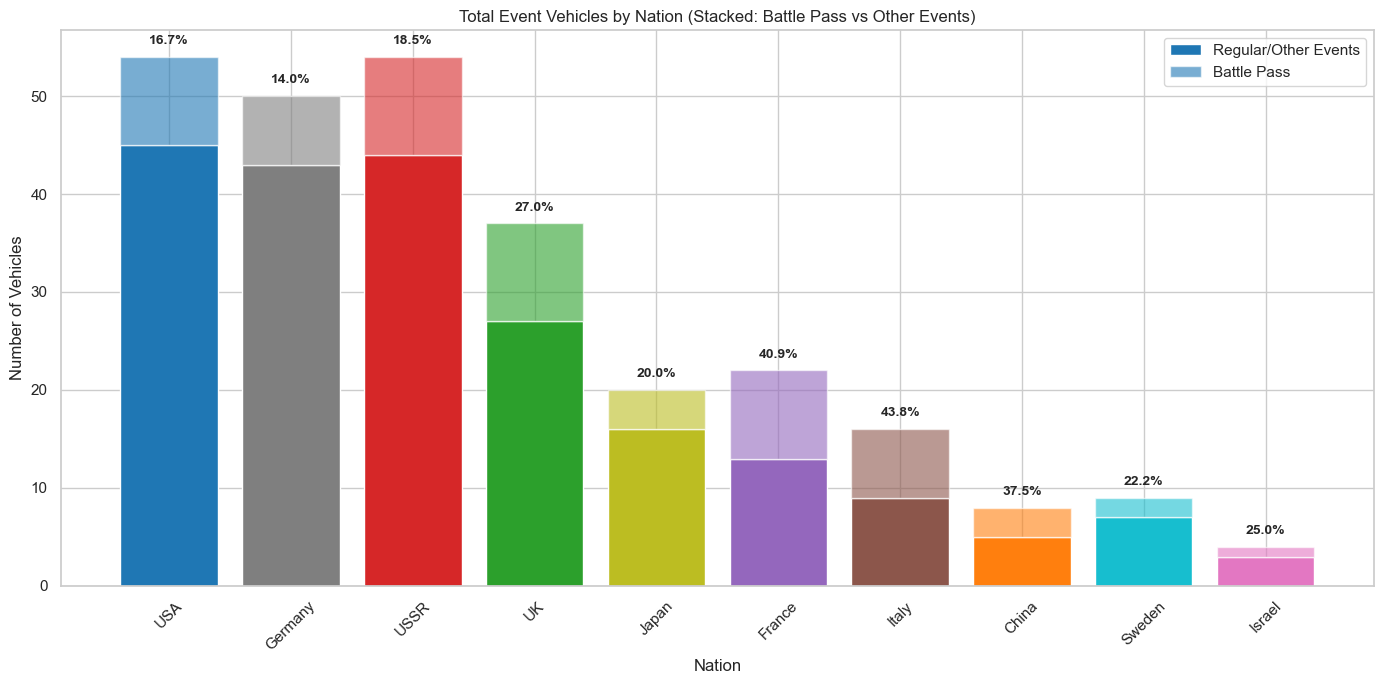
- France and Italy are heavily represented in Battle Pass content compared to their total amount of event vehicles, with over 40% of their vehicles coming from Battle Passes. This is a stark contrast to Germany and the USA, which have 14–17% of vehicles in Battle Passes. Once again a legacy from these nations coming later to the game, thus their event vehicles are younger.
- Even smaller nations like China and Israel show meaningful Battle Pass representation (37.5% and 25%), suggesting that Battle Passes provide an alternative way for event vehicles to reach their sparsely populated event vehicle collections.
- The UK has a surprisingly high 27% proportion, reflecting its strong presence in mid-tier premium vehicles.
This chart somewhat resembles the Player Battles per Nation, as seen in
However, one must also keep in the back of their head that the distribution also resembles the historical addition of these nations in-game. A lot of the larger represented nations in terms of event vehicles are also the oldest ones, which had several years of possibilities to have event vehicles added to their nation. This Legacy Effect is likely one of the main causes for the shape of the distribution, but does not solely explain it.
Table of Battle Pass Vehicles and Proportions
| Nation | Total Vehicles | Battle Pass Vehicles | BP Proportion (%) |
|---|---|---|---|
| USA | 54 | 9 | 16.7 |
| Germany | 50 | 7 | 14.0 |
| USSR | 54 | 10 | 18.5 |
| UK | 37 | 10 | 27.0 |
| Japan | 20 | 4 | 20.0 |
| France | 22 | 9 | 40.9 |
| Italy | 16 | 7 | 43.8 |
| China | 8 | 3 | 37.5 |
| Sweden | 9 | 2 | 22.2 |
| Israel | 4 | 1 | 25.0 |
Since the introduction of the Battle Pass, most nations have benefitted from these events, with event vehicles being distributed almost equally across nations. However, there are three nations which clearly benefitted the least from Battlepasses, namely Israel, Sweden and China. Possibly Japan too. All had 4 or less Battle Pass vehicles attributed to them, although all have at least one ‘top’ BP reward (Rank IV or V).
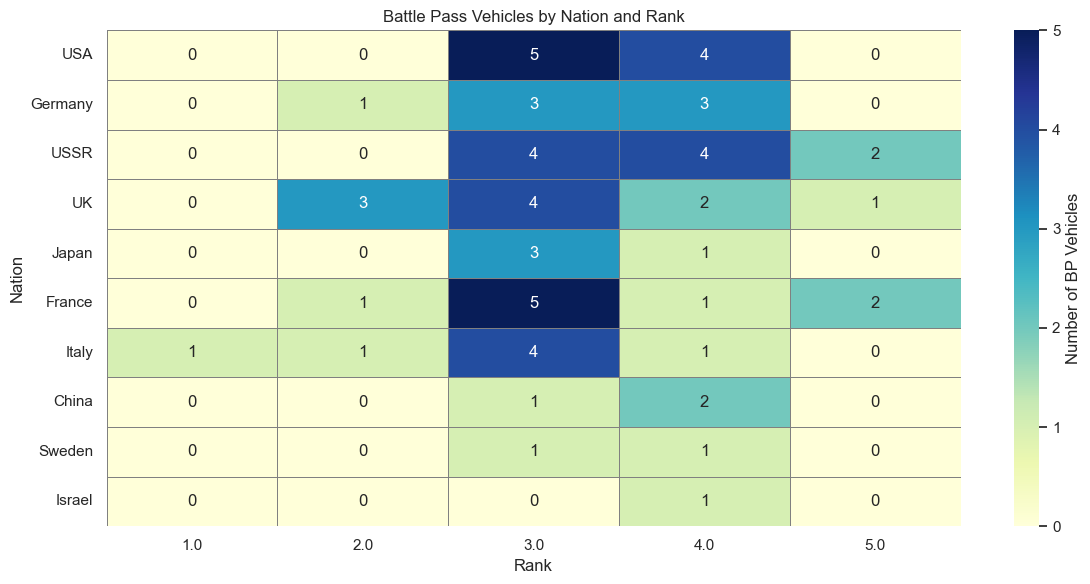
A few takeaways:
- Rank 3-4 is the sweet spot for most BP vehicles. That’s where you’ll see the bulk of mid-tier content.
- High-rank BP rewards (Rank 5) are concentrated in major nations: USSR, USA, UK, and France.
- Some nations (Israel, Sweden and China) still get mid-tier BP vehicles, but in lower quantities.
Key observations:
- Battle Passes skew slightly towards newer or smaller nations, giving France, Italy, and China a relative boost, to which before they had only few event vehicles, but overall distribution is still not equal for Israel, Sweden and China (with Japan to a lesser extent).
- BP events help balance overall representation, but smaller nations still get fewer vehicles overall.
Conclusion
Overall, the distribution of War Thunder event vehicles shows a clear hierarchy: major nations: USA, Germany, and USSR, dominate both high-rank and total event content, while smaller nations are more limited but not entirely excluded. Mid-tier ranks (2–4) are the most populated across all nations, making them the backbone of event rewards, and Battle Passes have helped give a boost to nations that historically had fewer vehicles.
Battle Pass content is particularly interesting: France and Italy gain disproportionately, with over 40% of their event vehicles coming from BP rewards, while smaller nations like China and Israel also see meaningful gains relative to their limited pools. Conversely, nations like Sweden and Japan, despite some mid-tier representation, remain on the lower end of BP gains.
The patterns suggest that event design balances historical event vehicle distributions with opportunities for newer or underrepresented nations, creating incentives for players to engage with a variety of nations. However, temporal data is limited. High-rank content remains concentrated among the traditional powerhouses, most likely fueled by player demand for premium vehicles, as these are the most played nations in game, as seen in Data Analysis #3: The arrival of Statshark answers some old questions.
Notes on Data Limitations
Data Limitations
- Possible Incomplete Event Coverage: Some very rare (Server Exclusive) or tournament-only vehicles are included, but the exact criteria for inclusion may vary, meaning a few vehicles could be missing or misclassified.
- Historical Gaps: Early events, especially pre-2018, had their ranks changed, and lost of the temporal data for non-BP vehicles was not manually added as that would take too much time.
- Player-Centric Metrics Missing: This dataset captures vehicles awarded, but not player acquisition rates, popularity, or usage in battles (like in Statshark), which could significantly affect the real-world impact of event distribution. As noted by @_Poul, Statshark only recognises 243 event vehicles compared to the total 279 distributed on all servers/events/tournaments/cups. Some of these haven’t been played in 2025.