How long do War Thunder games last in the different modes on average?
This is more than just trivia. Just measuring how many sessions are played in each mode, which we’ve been thankfully able to do in 2025 thanks to StatShark, doesn’t directly tell us how much TIME is spent in those modes. And when it comes to events, knowing how much score is made in a game doesn’t tell us as much as if we knew how long the average game was, too.
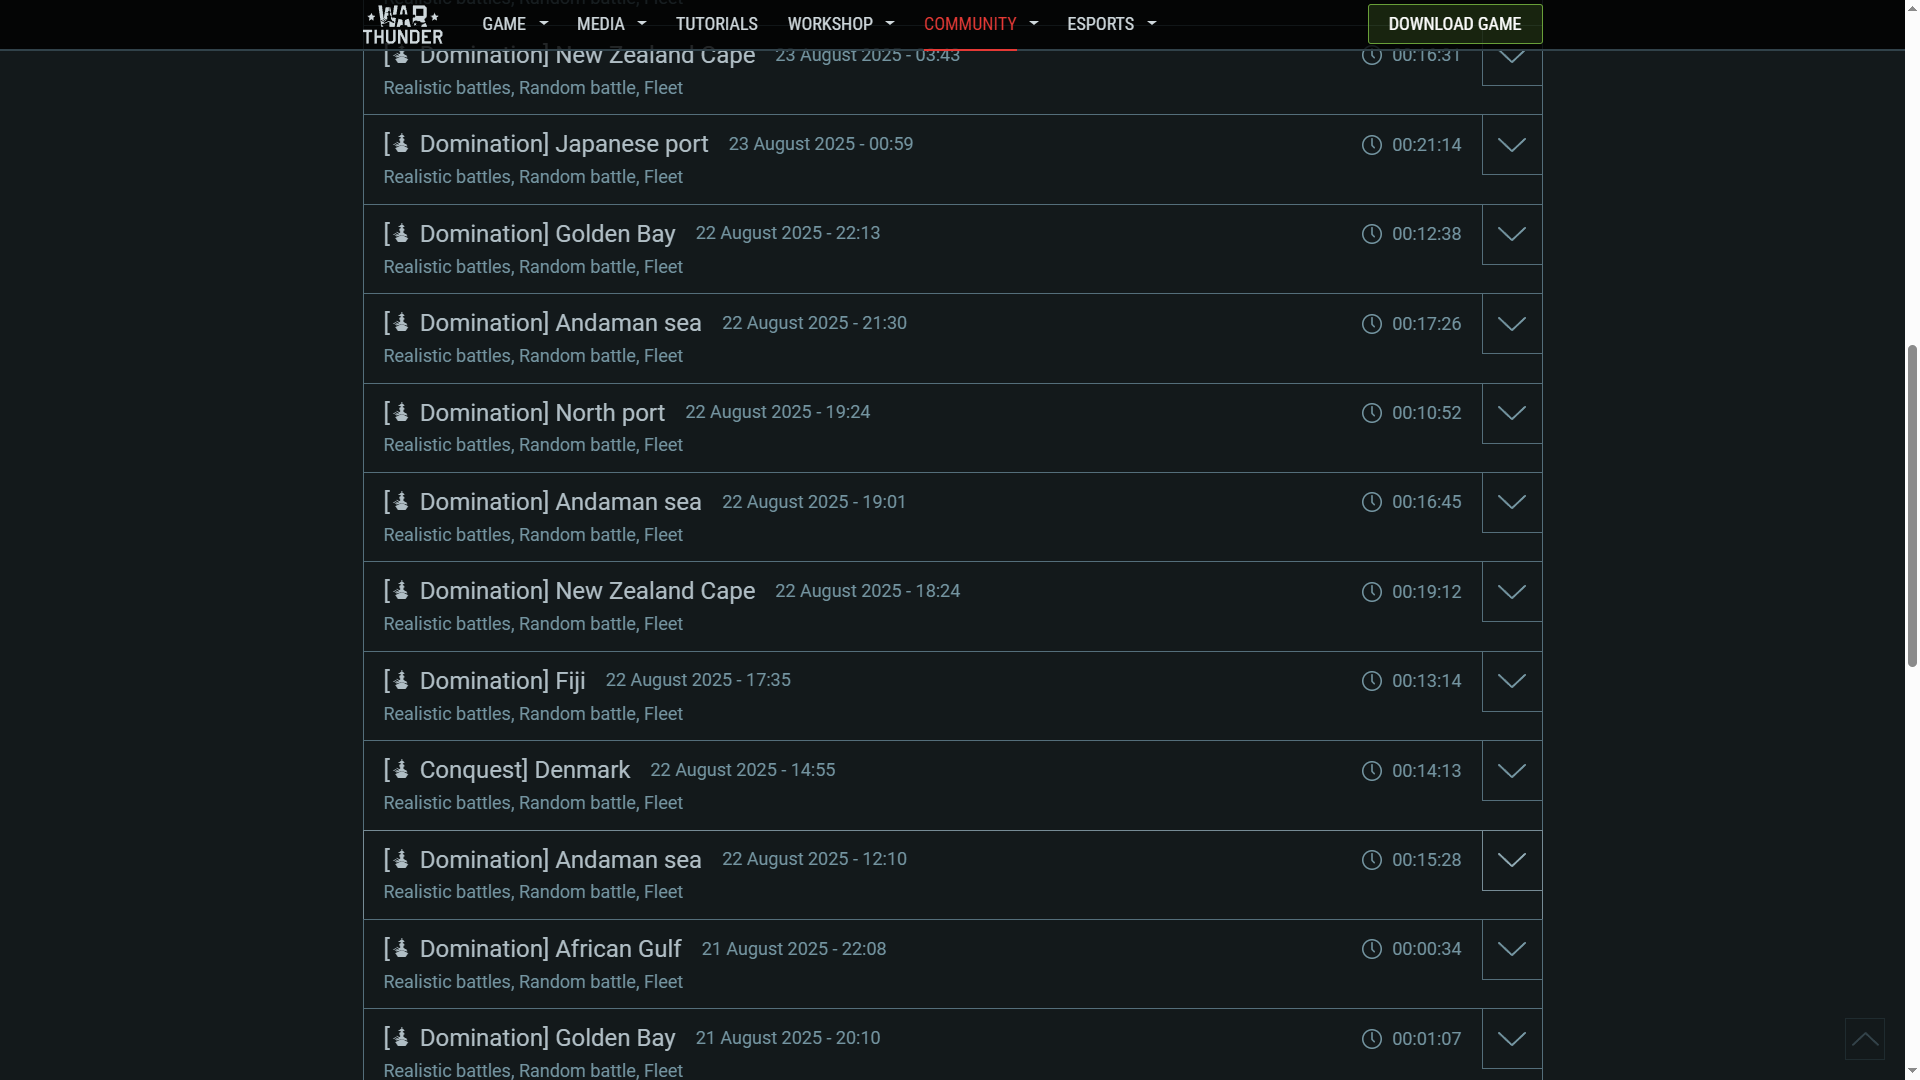
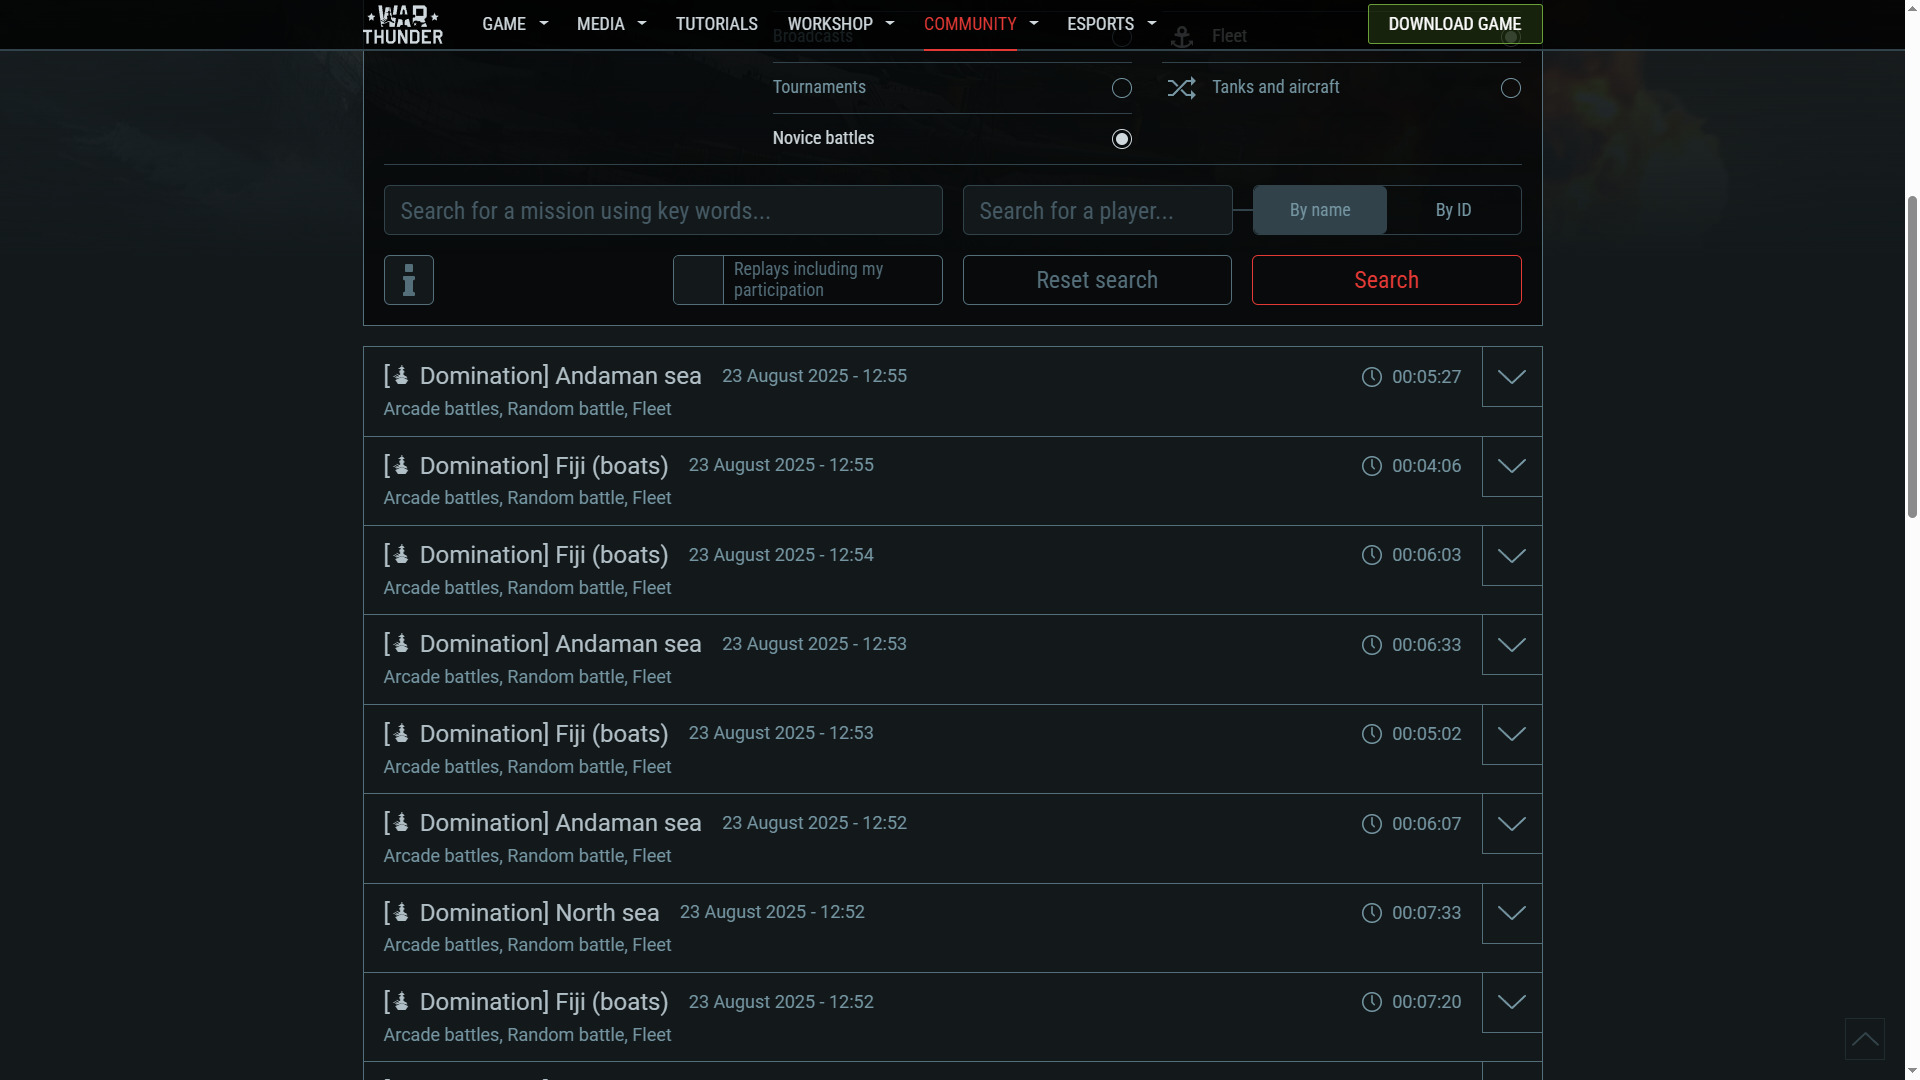
It should be possible to measure how long games last beginning to end by surveying the game durations on the replay site. It’s important to note though, that people leave games early, either because they’ve run out of spawn points or don’t want to play anymore, so any numbers we get through this method have to be seen as how long it took the game to run for the last people to leave it, win or lose.
That cautionary note aside, what are the average numbers for the various AB/RB modes? (Leaving aside sim and PvE for this analysis). I took a sample of 1057 AB/RB games, all played on August 8, and then added to it with additional samples I’d collected previously going back to July 27 to give a cross-tab of at least 250 games (a statistician would tell you you need about 400 randomly selected games to get a good mean/median here) in each of the six modes, for a total of 2,918 games. The games were collected during weekday European evening hours, with the longitudinal day chosen from the period between the summer naval and air events. Sadly I left out sim and the PvE modes as being too different to really compare here, although it was interesting to see their relative numbers in the longitudinal sample, with Heli/Ground/Air PvE all very small but still there, comparable to the naval modes.
Games started per minute during the longitudinal sample for all AB/RB ranged from 60 to 106, or a new game every second basically (which is itself still rather remarkable, at least to me as a measure of worldwide server load). In the longitudinal sample 42% were ground RB, 28% air RB, 25% ground AB, and 5% air AB (with 9 naval games in the 1,057 for less than 1%), which is reasonably consistent with other data we had previously on prevalence of matches. A small number of games less than 90 seconds in length (there were a few of these) were excluded as probable false starts/server glitches
The result was this chart:
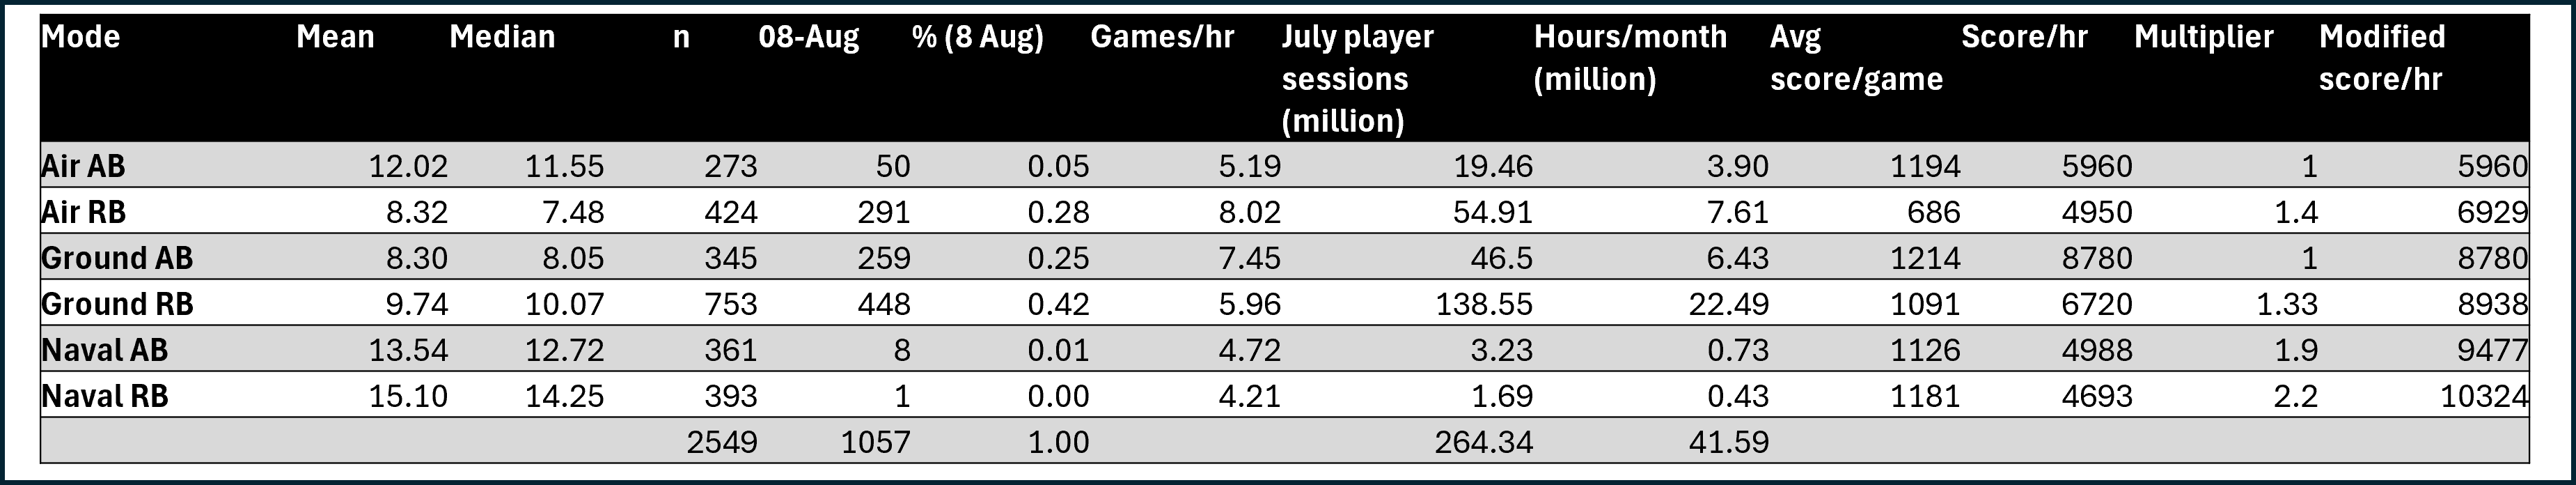
Naval modes had the longest average length (both median and mean), but air AB was surprisingly close. Ground RB was pretty much in the middle, with Air RB significantly shorter on average than AB; the situation was reversed in ground though, where AB matches took less time on average.
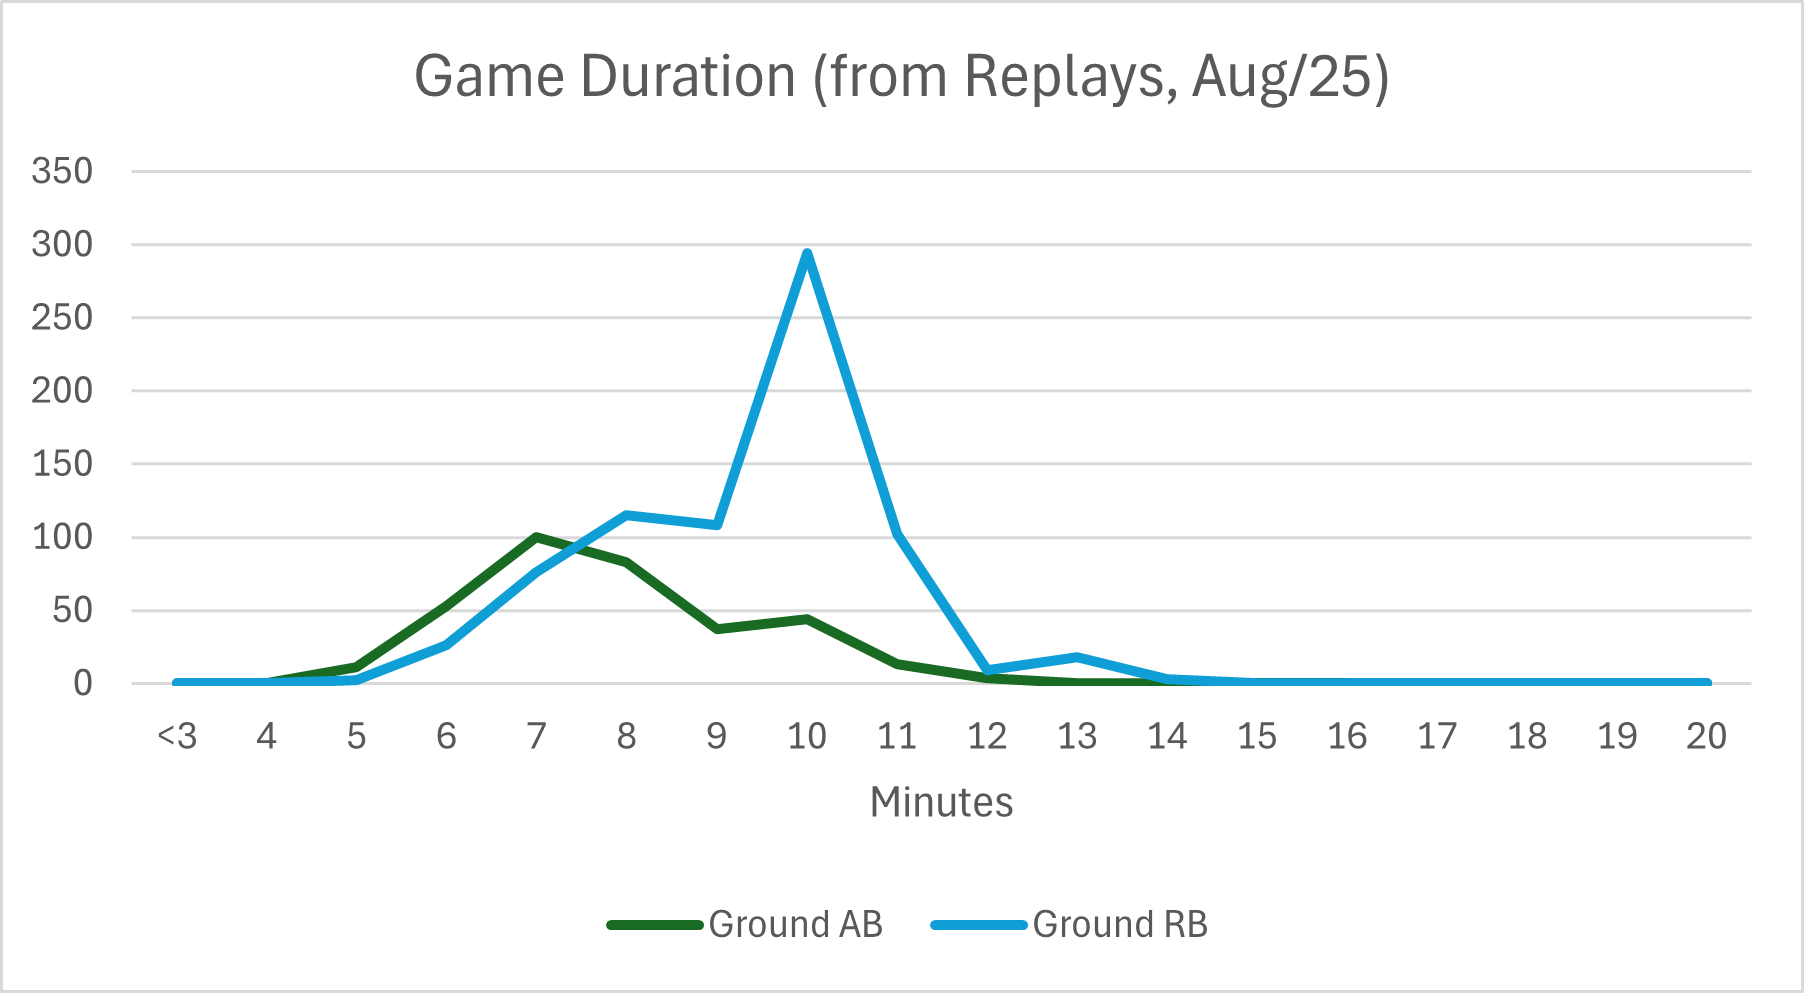
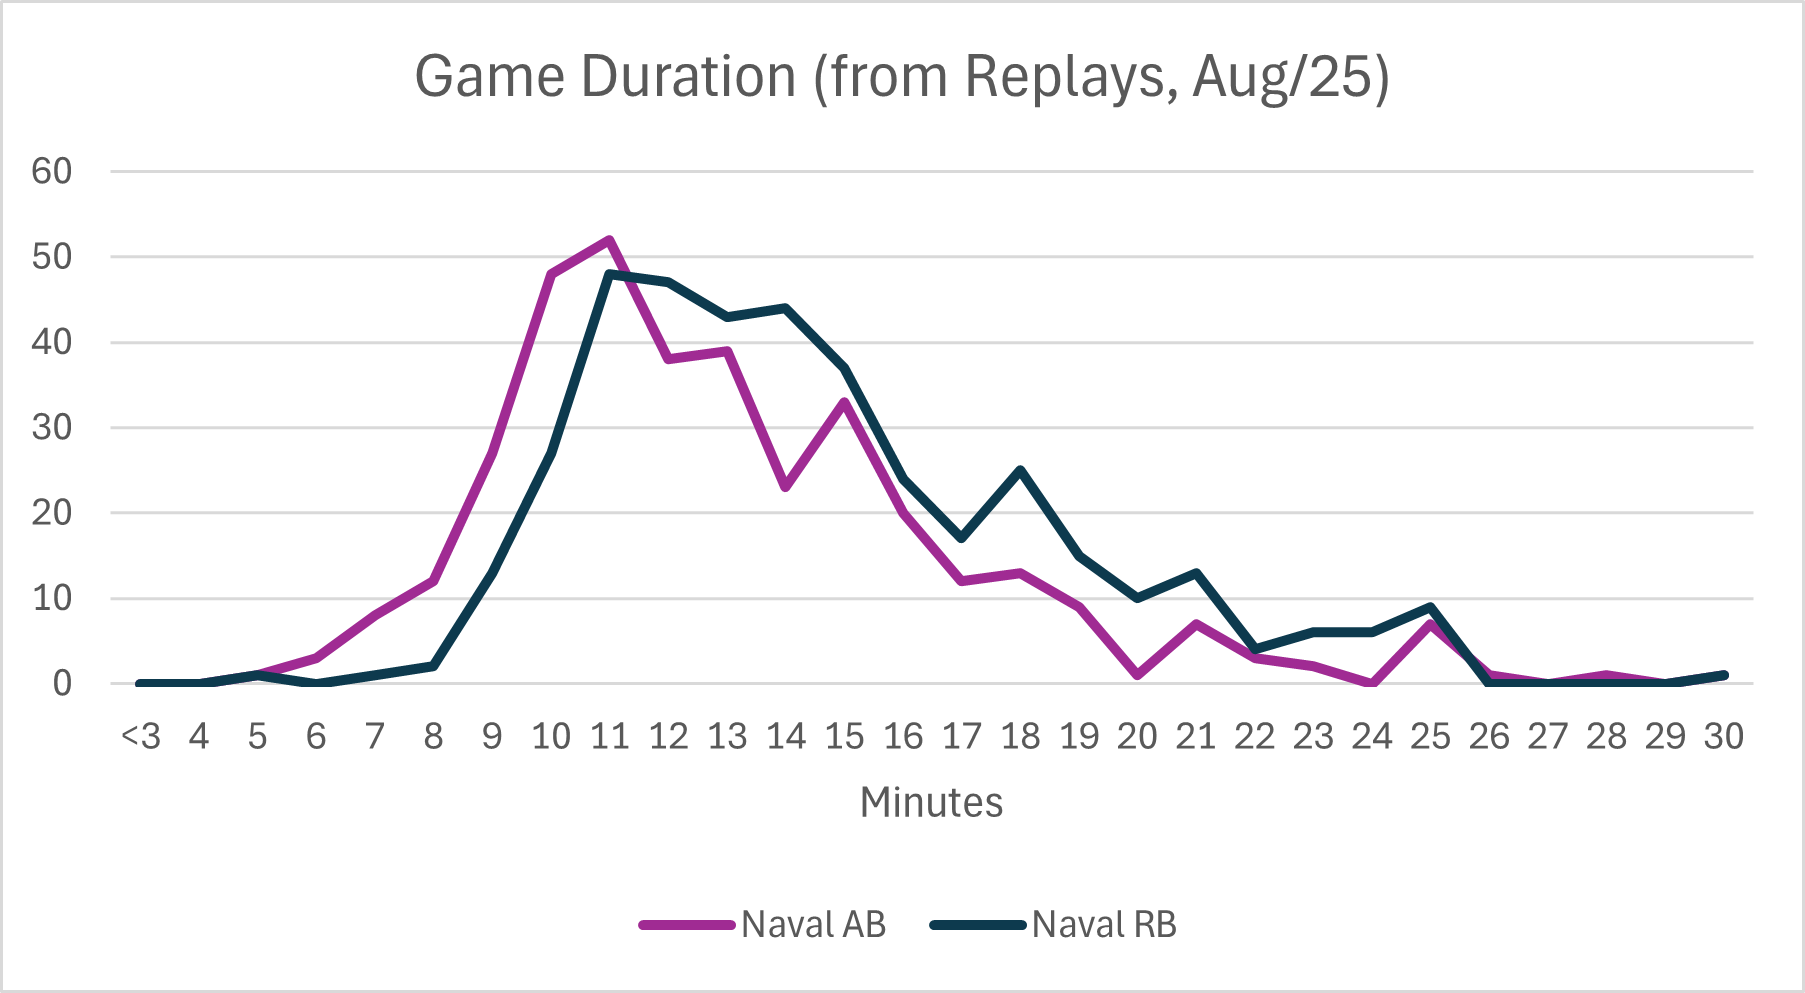
Mode and median don’t tell the whole story however, there’s also the shape of the curves (aka, the distribution) to consider. These are the curves of the three AB/RB modes in terms of time and absolute games measured in this sample.
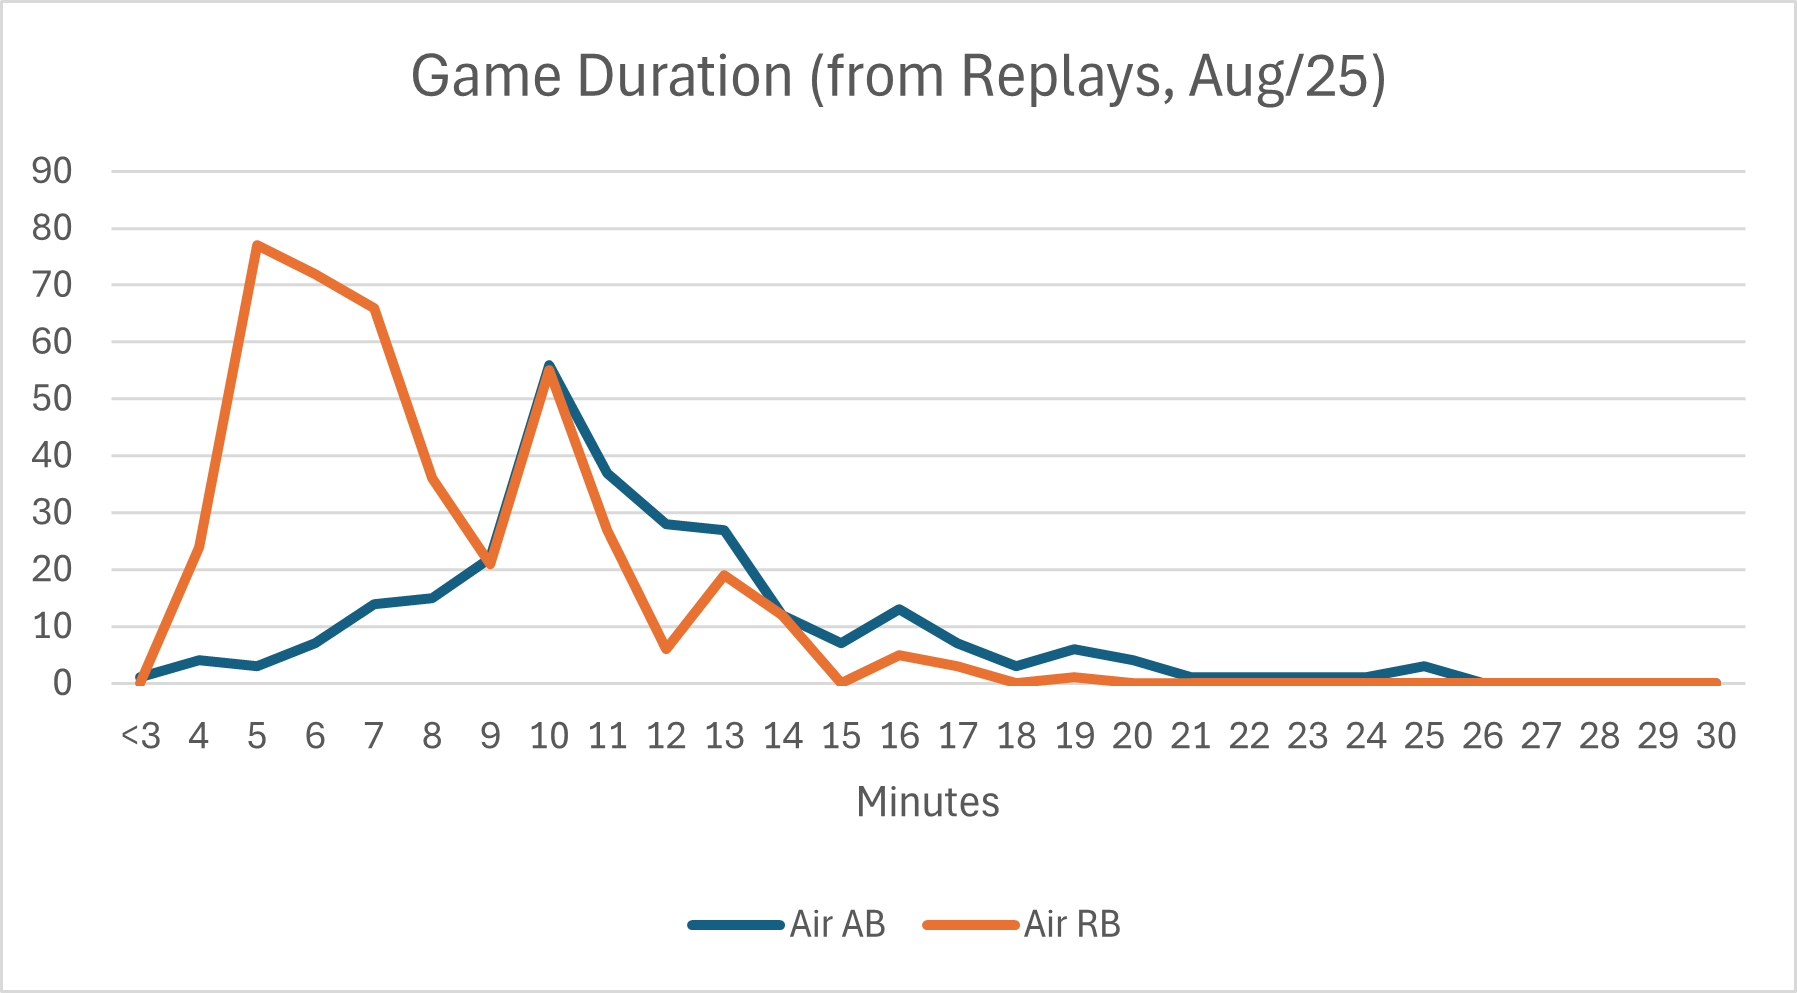
In Air RB, the peak is right around the 5 minute mark, while Air AB peaks at 10. This makes sense given that Air RB is concentrated towards higher end missile play, and also that it’s TDM while Air AB is concentrated more in the slower prop BRs and you have respawns and lineups.
In Ground AB, the average game is around 7 minutes long, whereas Ground RB that’d be a short game, with average games at the 10 minute range. This is certainly in part due to RB having unlimited spawns if you have the spawn points for it, whereas AB is capped at 3 ground vehicles.
Both naval modes are actually surprisingly close both in terms of peak (around 11 min) and how their curve trails off with time. There’s an idea out there that naval AB is significantly shorter/faster and thus more efficient, but it’s really not there in the data (it’s about a 10% offset from each other). As we’ve noticed in other respects, the two naval modes are not offering significantly different experiences here, the way the modes are differentiated in ground and air.
Question 1: Which modes are the most popular in terms of hours played?
So if average session lengths varied significantly between modes, that would lead to sessions not being as useful data, simply because a session in a shorter mode was the same as a session in a longer one in Statshark stats. So knowing how many millions of hours were played in each mode can be useful.
We know from Statshark that there were about 264 million player sessions in July and the proportions between the modes are pretty similar month to month. If we multiply mean time/mode by those numbers, and express it as a proportion of both sessions and hours played in that mode (41.6 million total hours by this math), you get this graph.
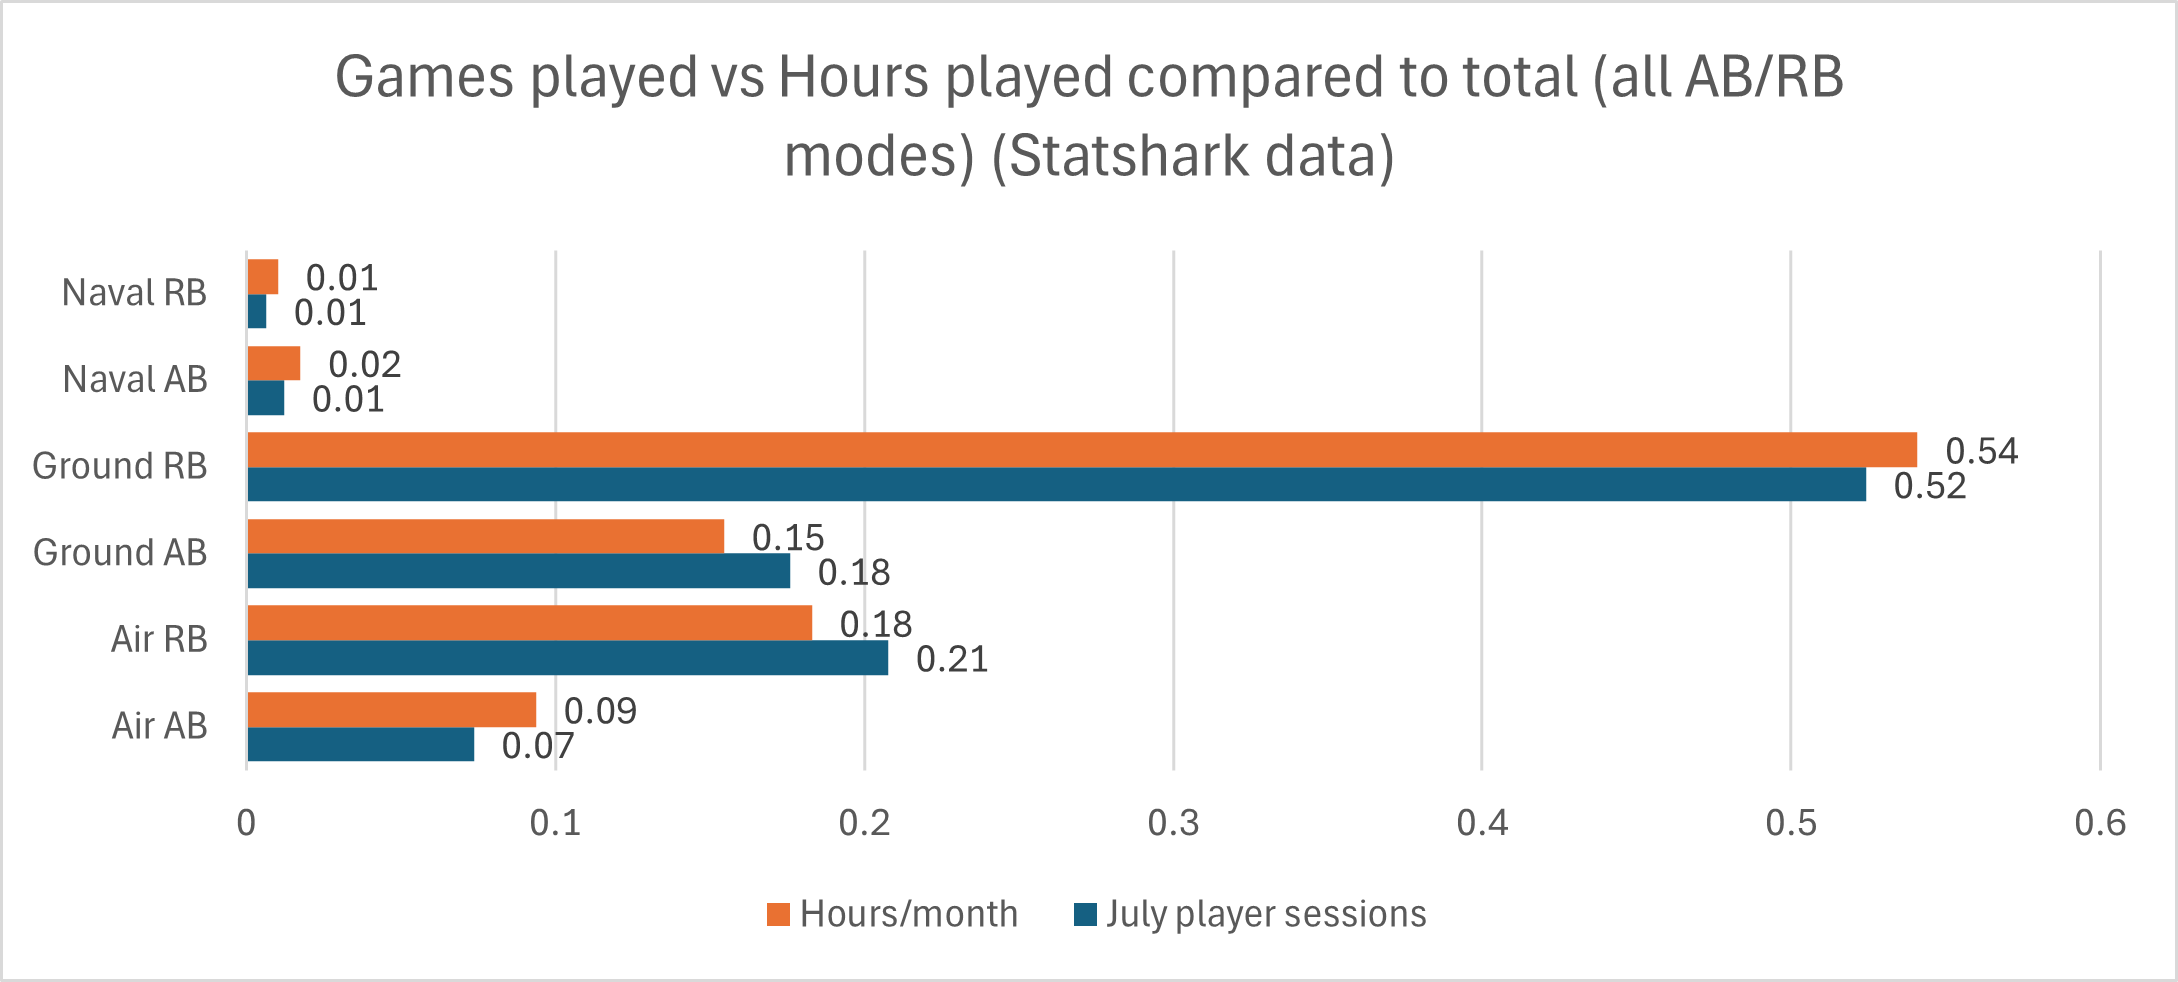
Ground RB, by dint of longer game length, becomes slightly more dominant: 54% of game time vs 52% of matches. But overall the changes are pretty minor, suggesting users session can still be pretty useful data for evaluating AB and RB; knowing time played doesn’t really significantly alter our evaluation of a mode’s popularity.
Question 2: Which modes are most lucrative in terms of score and finishing events?
So we know average score per game in each mode from Statshark as well. Knowing a mean game length gives us an idea of average score per hour, which can be useful if you’re deciding how long it’ll take to finish one of these vehicle events.
Note: as a player you have a lot of control on this. You can minimize your time in lobby, change your server parameters to reduce queue time, leave games early rather than dragging them out to get in more games, play modes and BRs where you personally score well, and so on. What this is here is the playerbase average game length (playing all the way to the end) times the playerbase average score, by mode, that’s all. Leave your tips for beating the statistical odds in the comments below :)
Doing that math gives you this graph. (Note: Ground AB recently had its multiplier increased from 0.93 to 1.)
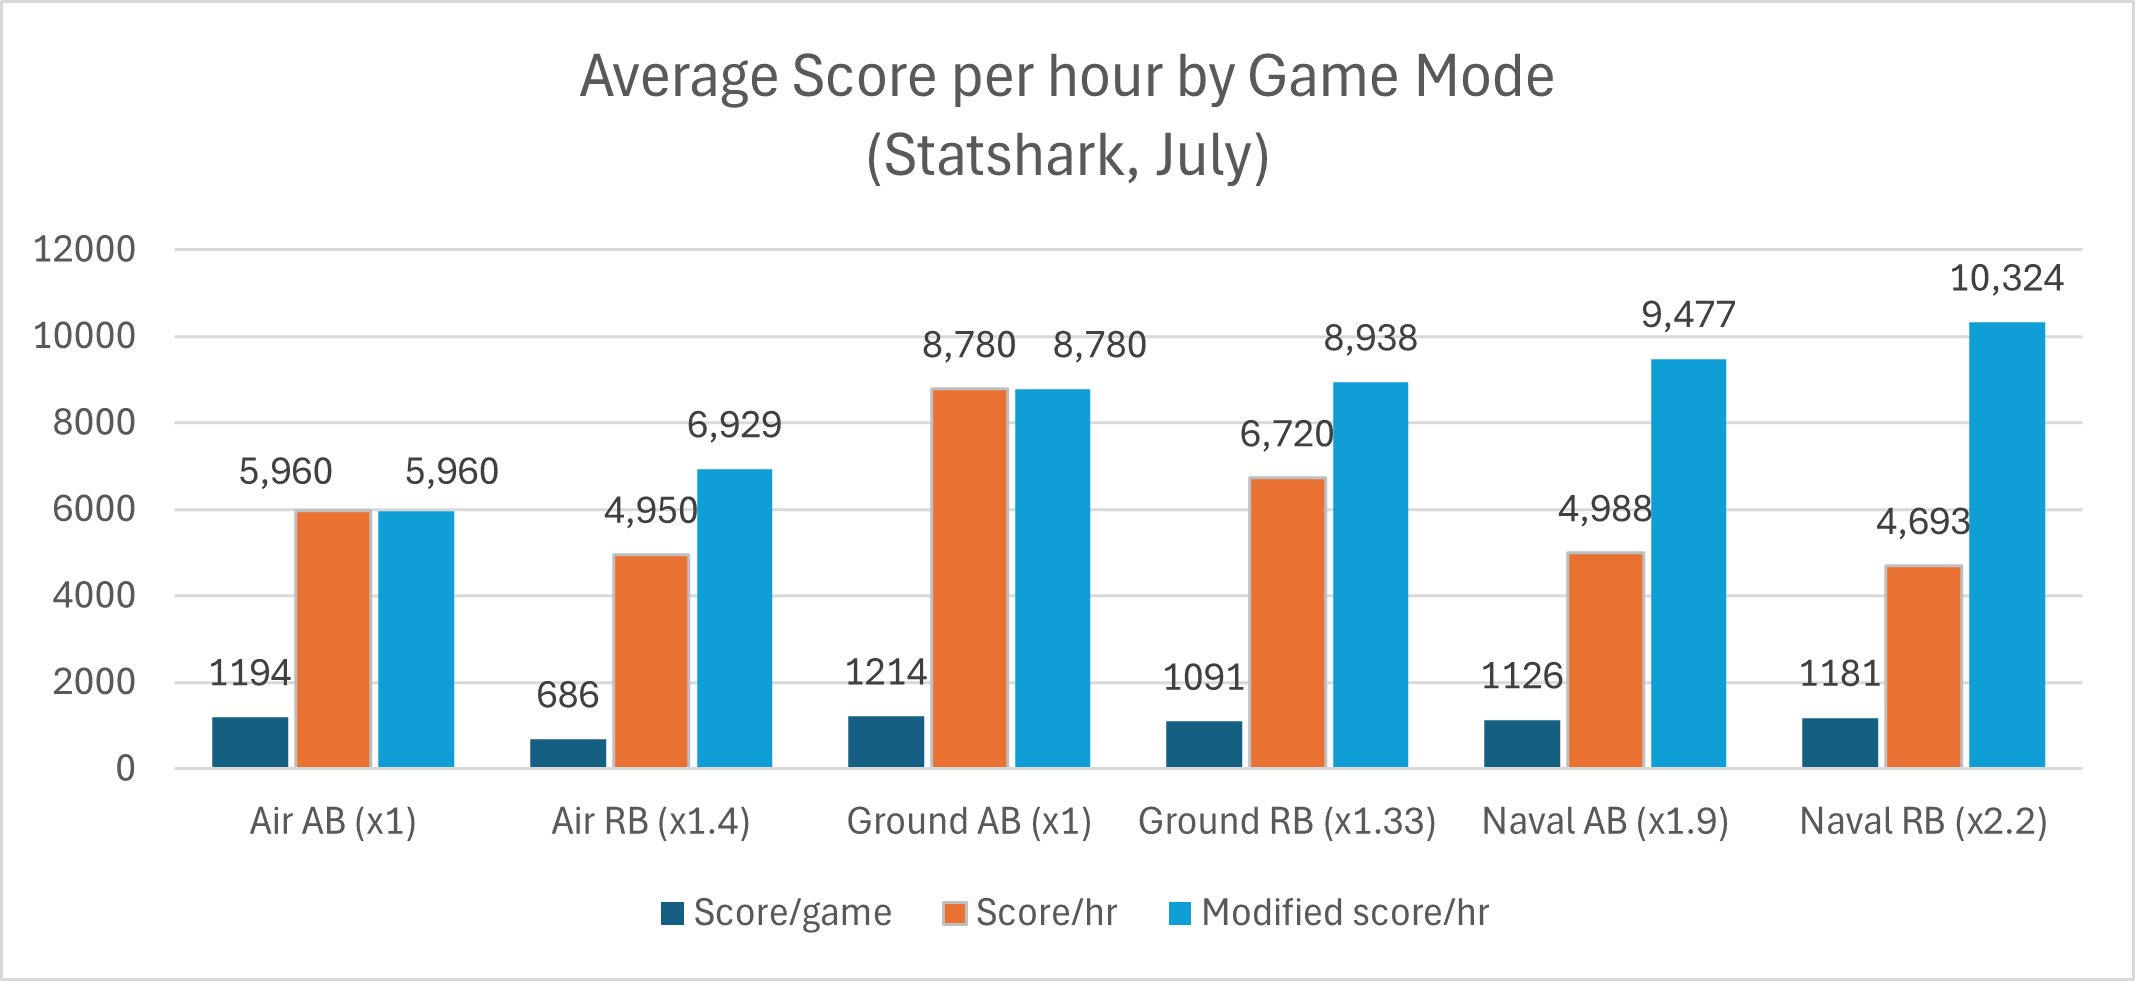
In general, the RB modes on average are still more lucrative than AB, their longer game lengths not offsetting their better multipliers fully. The other thing that I think should be obvious is air modes are currently relatively under-rewarded compared to ground or naval. In general this makes air-based vehicle events, like the F-106 one about to start tomorrow, harder on average, requiring more player hours in total for the same average reward, than ground or naval. This in turn leads to a lot of players more aggressively optimizing their play time for air events (using base bombing strategies, and the like)… in the other modes you really can just play. In air you have to be clever about it if you want to complete the event in the same amount of time. It’s not that in other modes players don’t also “turn it on” to compete events fast. It’s just in air they have to do it more. In this one sense at least, the air modes currently are the hardest to “do well” in.
Previously in this series:
Data Analysis #4: Pushing Past a Simple K/D Using Statshark Data
Data Analysis #3: The Arrival of Statshark Answers Some Old Questions
EDIT: Updated to change the ground AB multiplier to the correct one.