So some good news this month was the return of aggregate player statistics on Statshark.net. Back in February to September of 2025, this had given players their first ever really good idea of the kind of statistics Gaijin actually has on the player base in terms of the modes we play, the countries we play and the Battle Rating ranges we play at, as well as things like whether we are more likely to be overtiered or undertiered in a match at a given BR.
After those 8 months of interesting data Statshark dropped that feature, but has brought it back this month. You can find it on their page looking for Global Vehicle Statistics, and then selecting General Statistics and Games Played, which gives a table of all games that month in the PvP modes, broken down by match BR, nation and mode.
It’s important to note a couple things about this data: first off this is the match BR (not your lineup BR), and every player in a match is only counted once. So in a 16v16 game with a top BR of 3.0, 32 “games” would be added across this table, all at the top BR of that match, divided up by the national trees used in that match. This means the numbers here are not going to lineup with the “Games Played” or “Spawns” you find on individual service records, which increment by 1 for every unique vehicle flown or driven out (with use of backups included for the “spawns” statistic), except in Air RB. To keep it clear which we’re talking about, I’m going to continue to use the phrase “player-games” to reflect what’s in this Games Payed table.
(The Games Played table is much more useful than the Statshark Player Count table for this reason. That table counts every actual human player who has played that mode multiple times as a unique, and since it’s the match BR, depending on the matchmaking you could be counted 1-4 times even if you never varied your lineup in that mode that entire month. So people playing with greater lineup variety looks like more people.)
It is also a little unclear how and if this Games Played table is handling modes other than standard random matches. It is possible that all or most of the new PvP submodes we have (Naval EC, etc.) are also included in these statistics, and there’s good evidence that some probably are. But special events, or other activities that are PvE only or without standard BR matchmaking rules (such are the current WW1 event) are probably not being counted in these listings, so that should be kept in mind. Note this would mean that a long Air SB or Naval EC match counts as one “player-game”, the same as a 15-minute random match.
So the data has some issues to keep in mind. But it appears to getting collected legitimately by the Statshark site, and if they’ve cured the issues with how they were obtaining it that stopped them back in 2025, I see no reason not to continue to look at it, keeping in mind that this is a third-party site, which could have imperfections in its collection method on any given month we cannot know, and so there could be variations from the actual proprietary Gaijin data as a result for the same time period. But given that caveat what can it tell us about the game in the fall of 2026. Well, a few things.
What are the most popular PvP modes?
I’m going to use comparative data here when comparing October 2026 data to the last good data we have from September 2025. Obviously those are different months, at slightly different points in the game’s annual cycle, so increases in the raw numbers of games here could be misleading. On net the data shows play rates broadly consistent with what we saw in 2025, so the game does seem to be holding its audience overall.
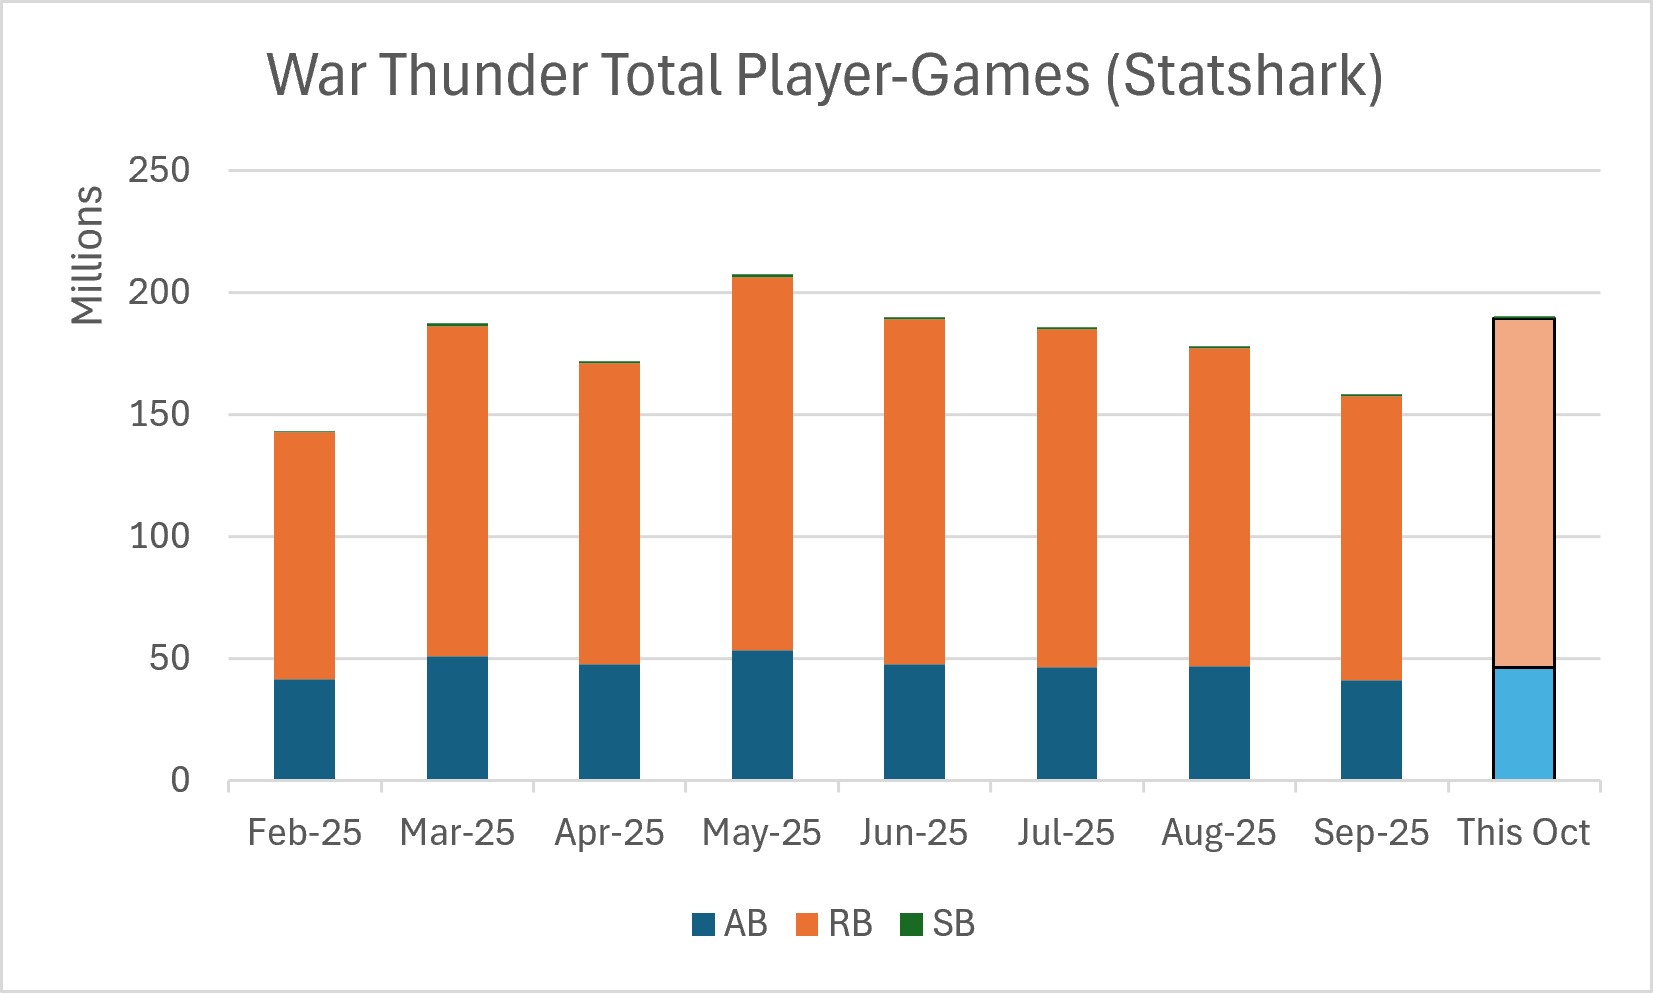
What the data shows is that Ground RB continues to be the dominant mode, with Ground AB and Air RB continuing to vie for second place. Air AB continues to draw a good crowd, while the naval and sim modes continue to be very niche.
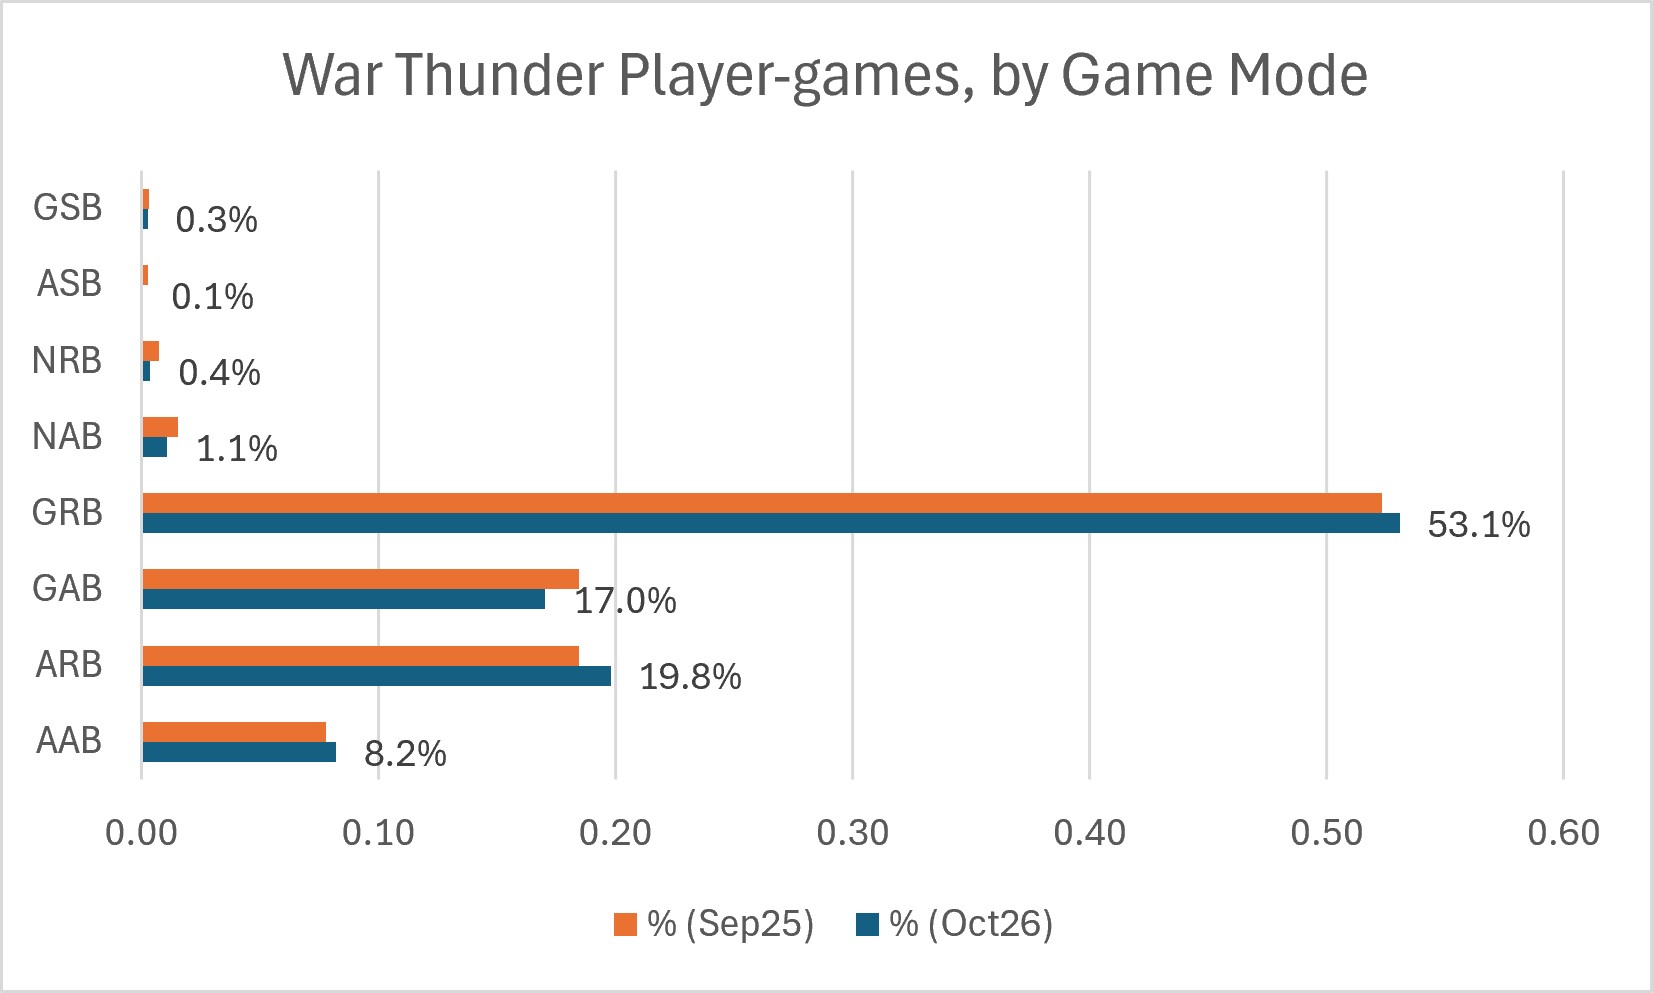
The only change in the last year has been a dramatic drop in player-games in naval modes and Air simulation player-battles. For naval modes, this could be at least in part the effect of 24/7 naval Enduring Confrontation (EC) matches coming to the game, again assuming those are being counted as regular matches, which seems likely. This would decrease the amount of player-games overall by increasing match time; but it could also reflect some amount of reducing the average number of players in a match due to increased bots, both effects of which would mask whether the naval modes overall are in fact significantly more or less popular than a year ago. Also, in naval the entire change if you drill down is taking place at BRs 3.3 and above, the BR’s where you can play 24/7 EC, now, so this is likely a major reason for naval numbers on paper looking lower. The precise reasons behind the significant decline in Air SB over the last year is also a good question: unlike naval we can see a reduction in player-games crosses the entire BR range for sim Air.
However, the 4 major modes (counting Air AB) are very healthy and the game as a whole certainly hasn’t lost players from a year ago, and, at least evidenced by this single month of stats, could even have seen growth over the last 12 months.
What are the most popular nations?
Always a fun question, what nations were people playing in October and how did it change from a year ago. Specifically are any nations challenging the “Big 3” (Russia, US, Germany)?
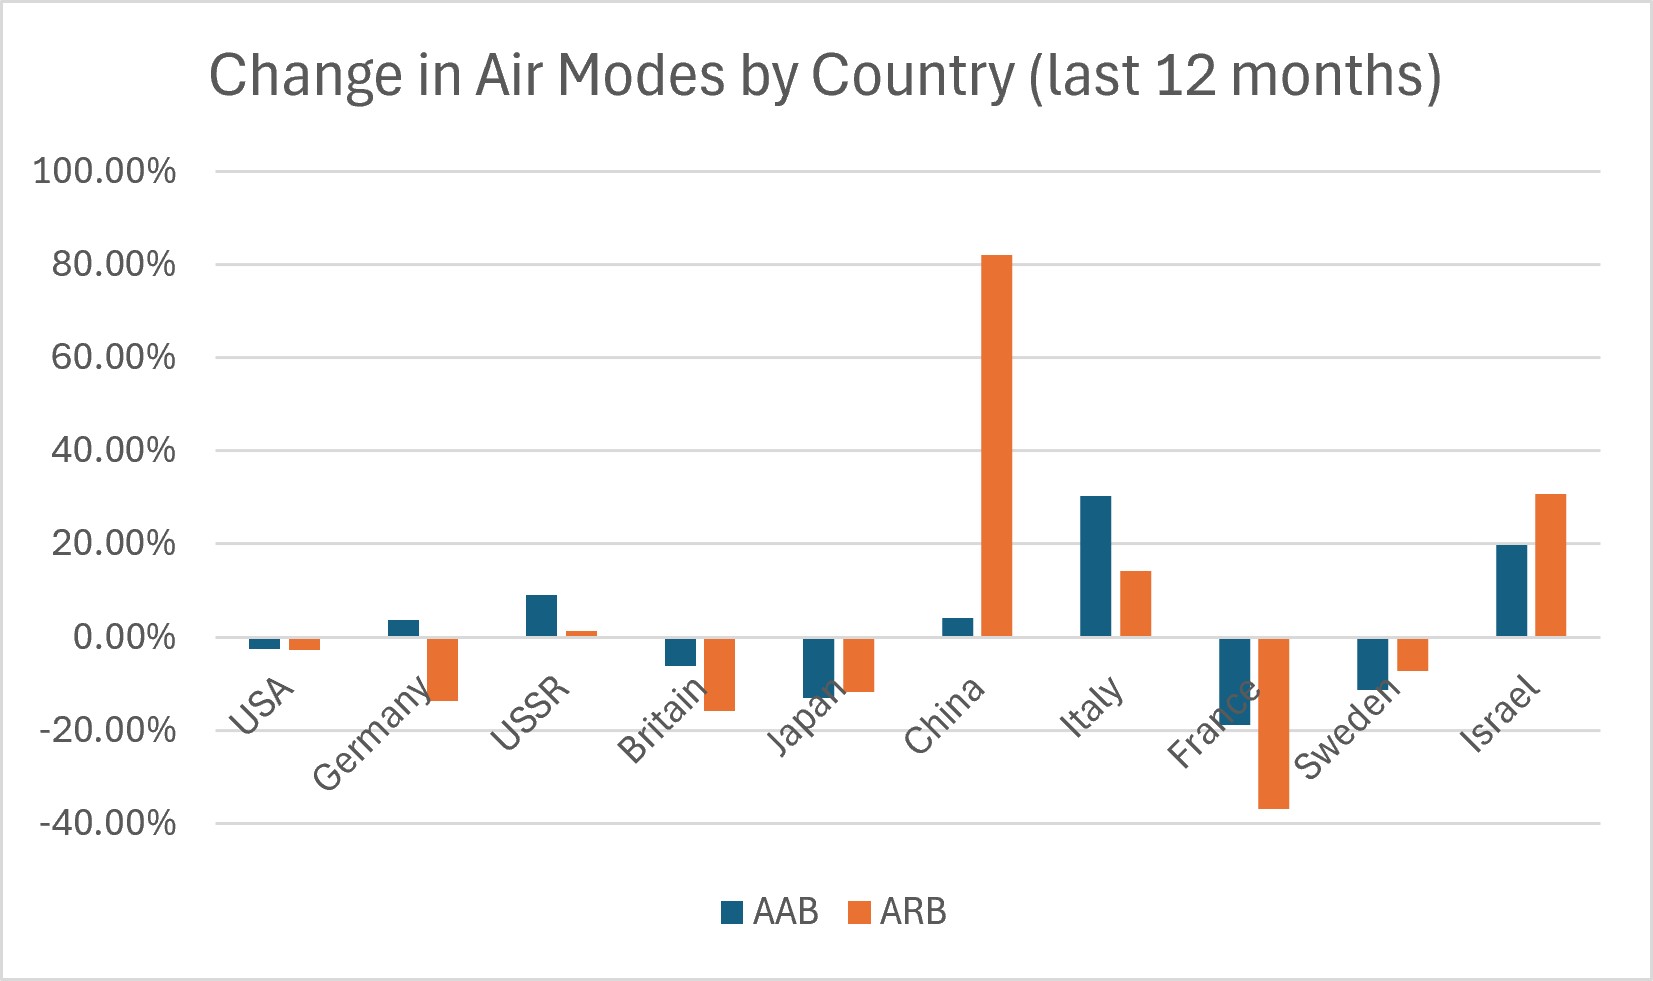
The story this last year has been the rise of China, it seems. In Air RB it has passed Germany as the 3rd place choice, behind the usual 1-2 of the US and Soviet Union. (Germany remains stronger in Air AB, however). Italy and Israel have also gained ground, with the other nations dropping in relative terms.

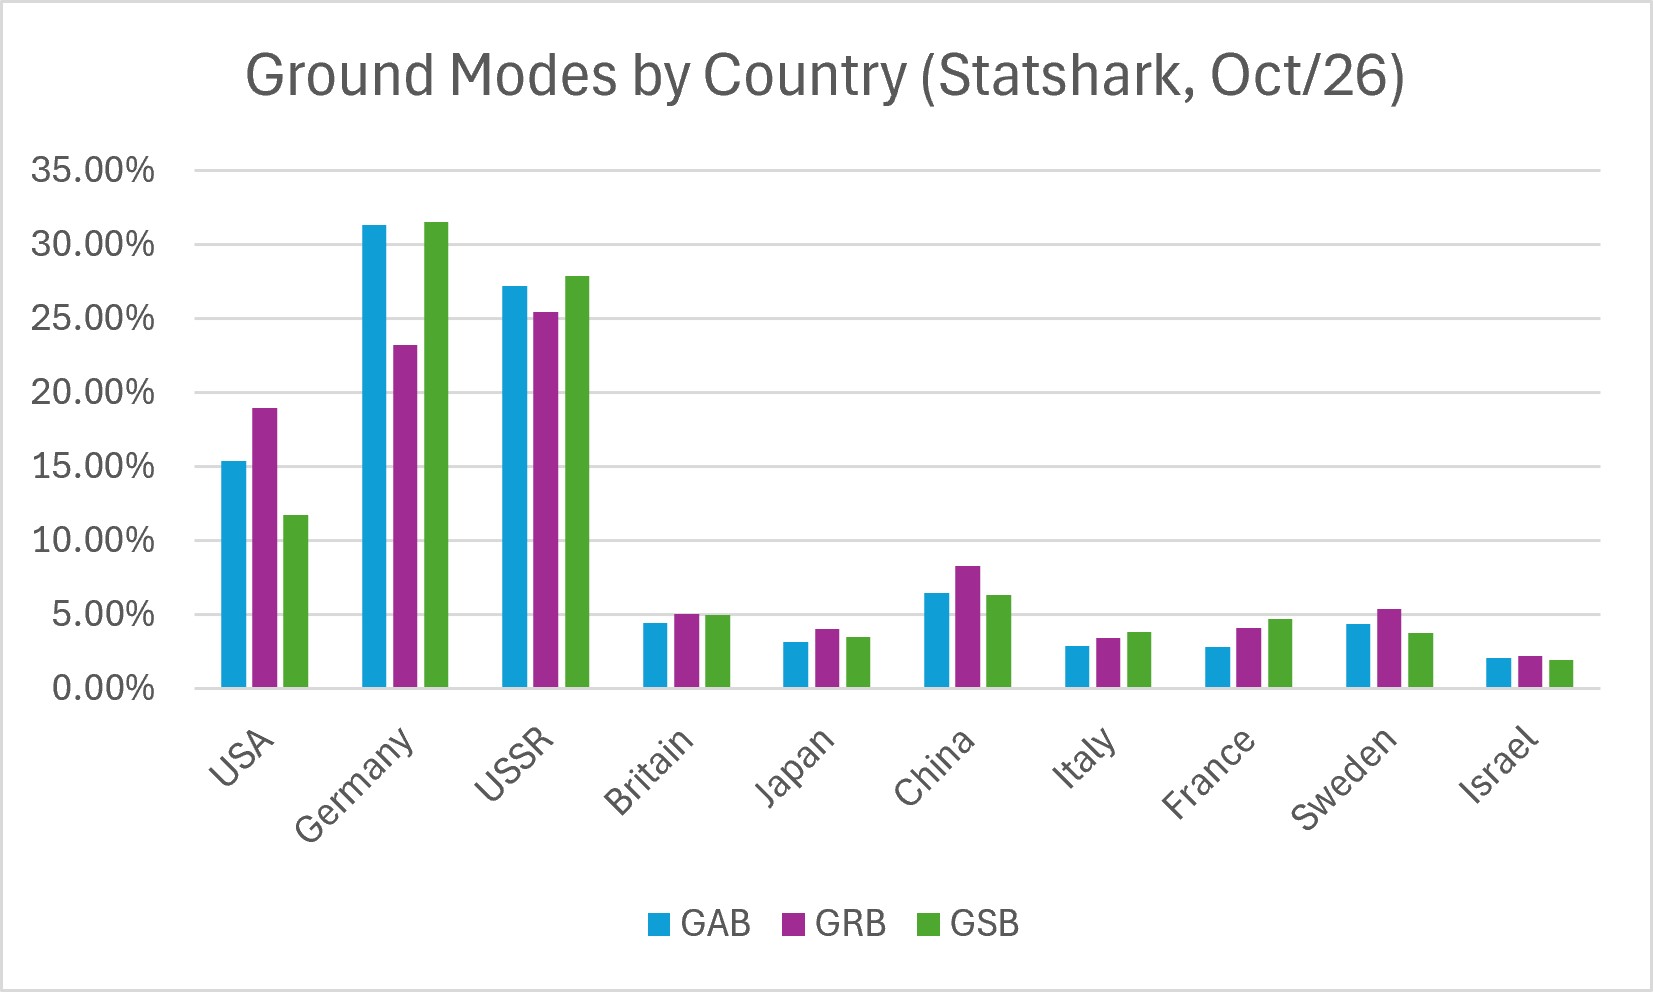
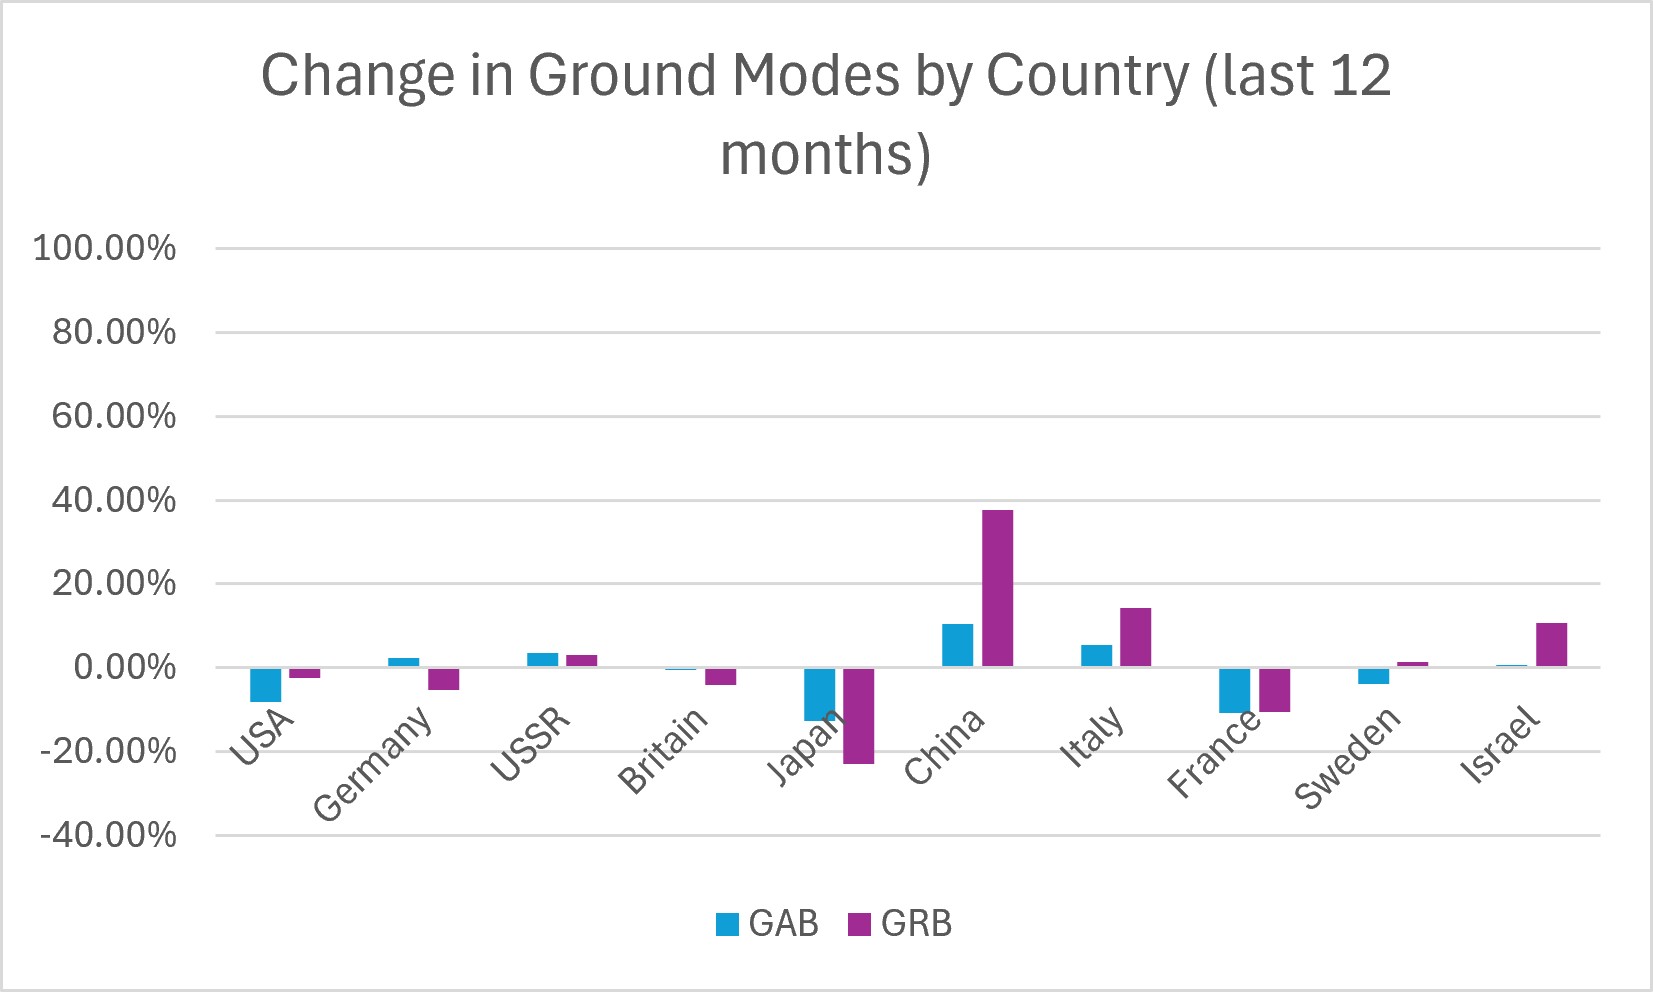
In ground modes, Germany (in AB) and the USSR (in RB) continue to dominate with the USA in a slowly declining but still clearly third place, but China has made up some ground in this mode as well, moving up to a solid 4th place, as has Italy and Israel again, with France and Japan in particular among the “minor country trees” losing the most ground to them overall. There seems to be some synergy here, with a nation’s air and ground popularity being somewhat correlated; this makes some degree of sense given that having a better air lineup helps you in ground RB.
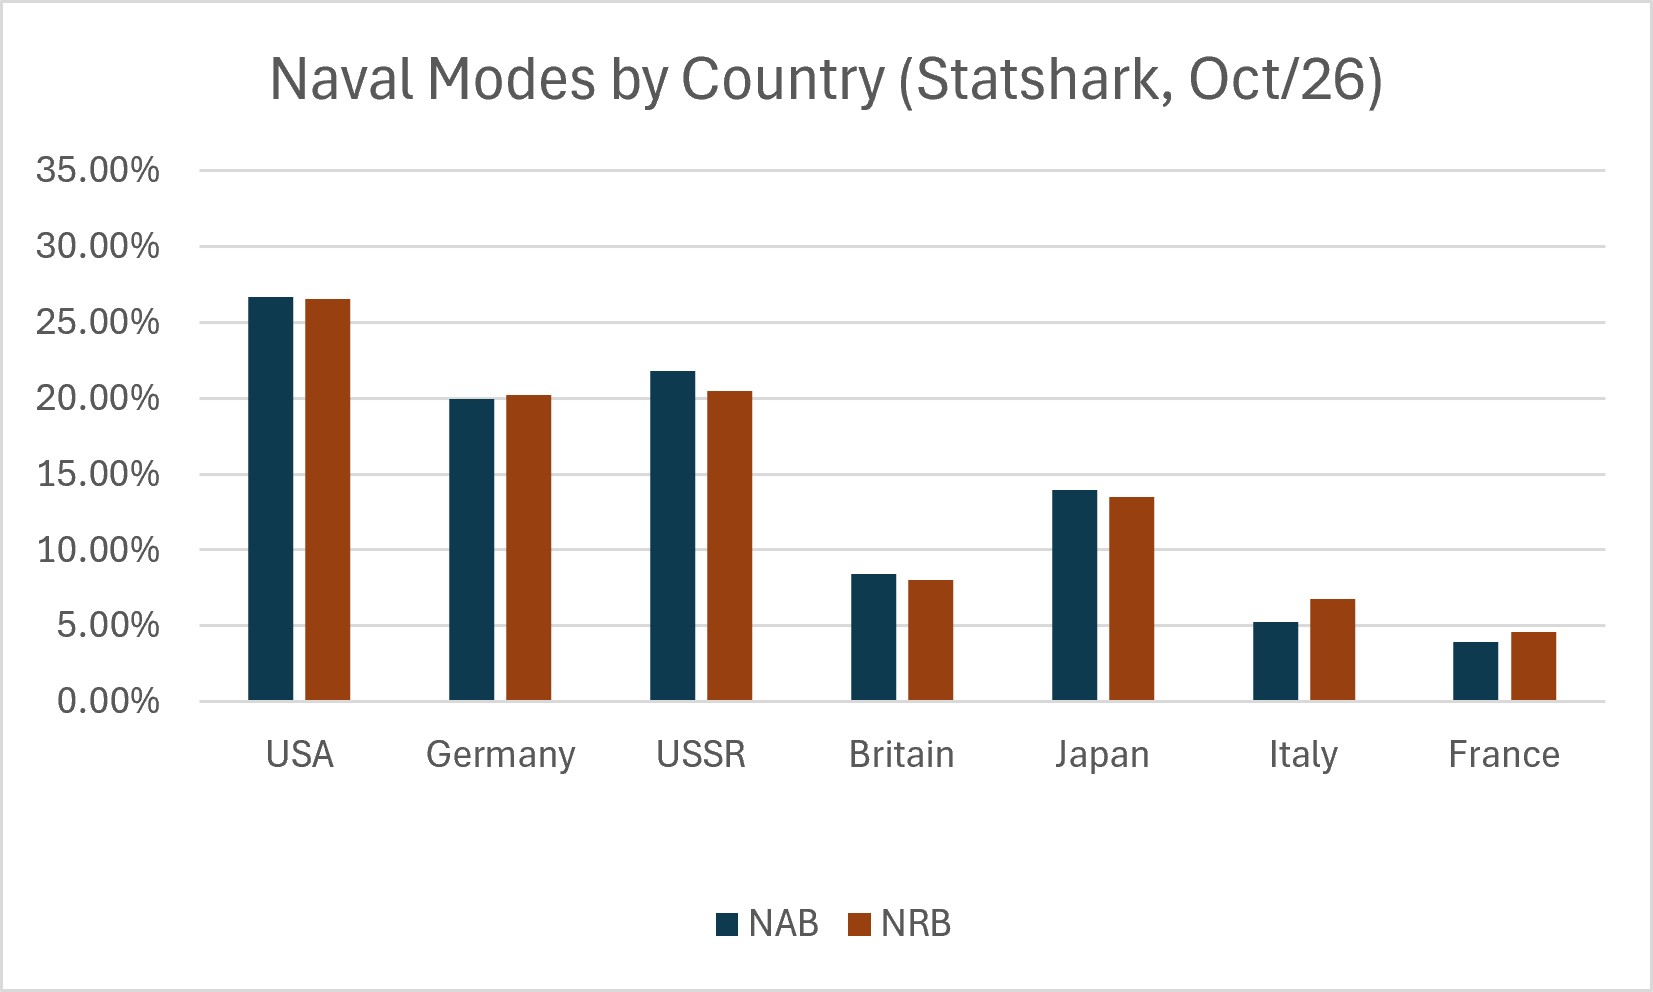
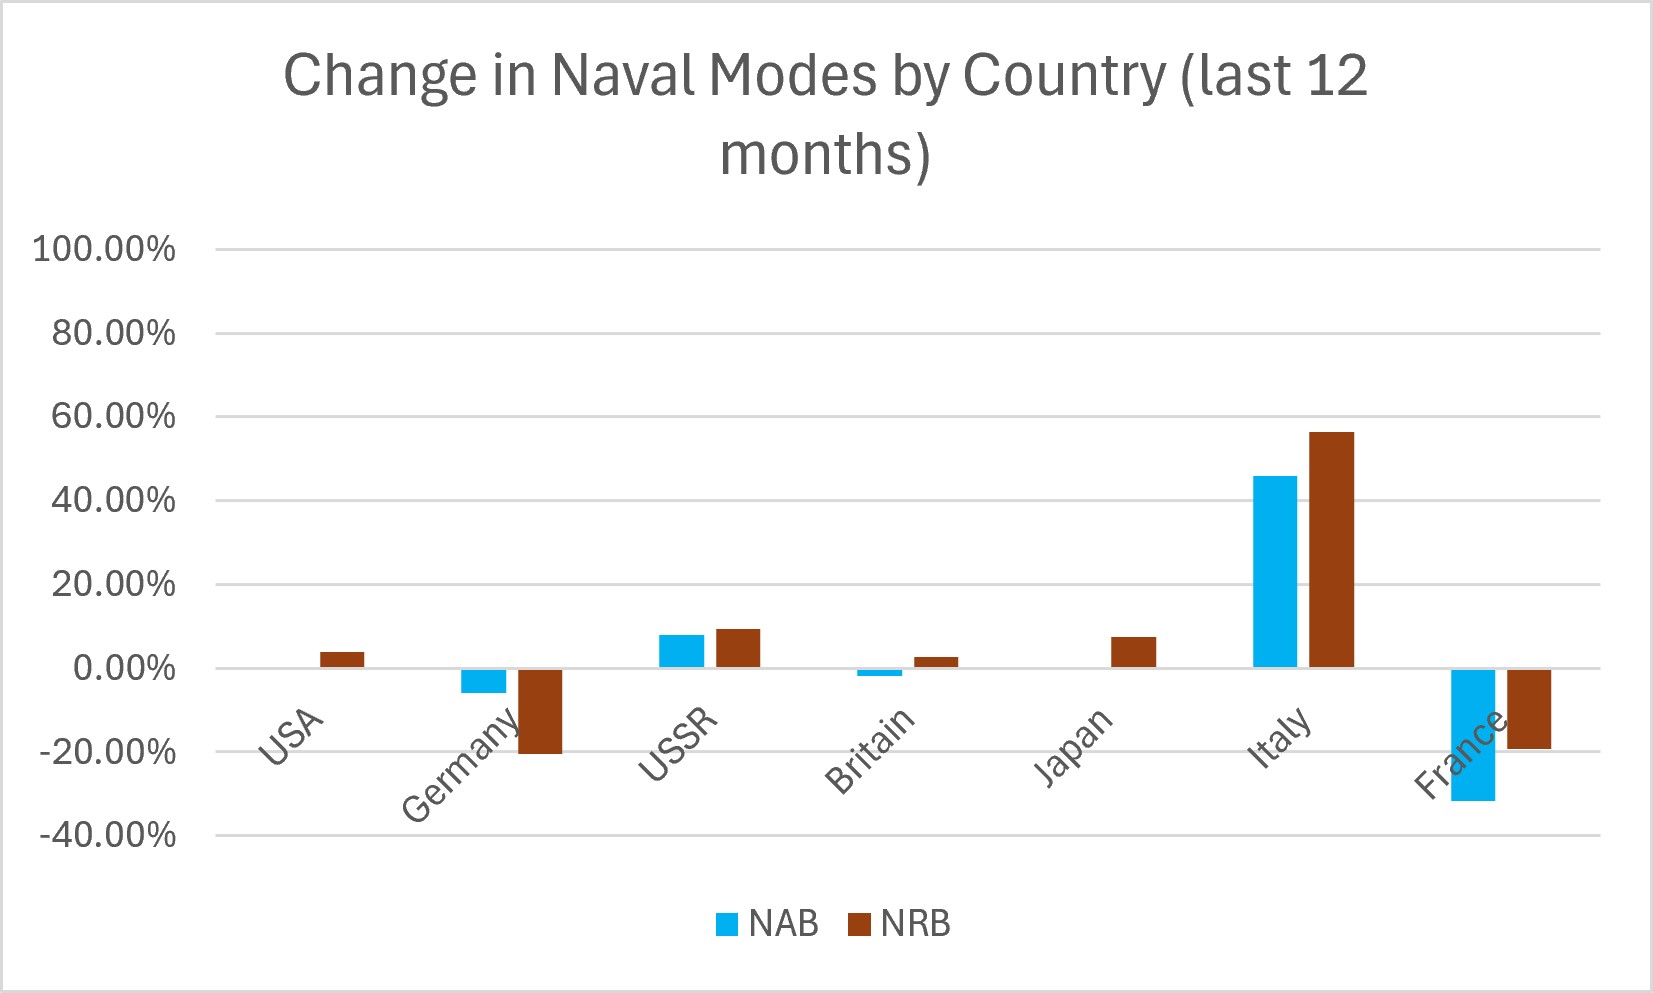
Naval I think shows how doing well or poorly in the more popular modes can have synergies with naval as well. Here the US-USSR-Germany trio continues, with Germany slipping a bit, and Japan in a solid 4th, but at the tail end, Italy seems to be pulling away, leaving France in last place. It is plausible that playing deeper into the air tree in Italy also incentivizes also doing things like daily naval challenges as Italy too: obviously being a bit of a nation-main in this way has advantages for things like crew skill gain across the modes as well, so some level of correlation would seem likely.
What BRs are the most played?
Is War Thunder’s audience more focussed on WW2, Cold War, or modern combat (as shown by higher BRs)? The answer is that there hasn’t been much change over what was true a year ago.
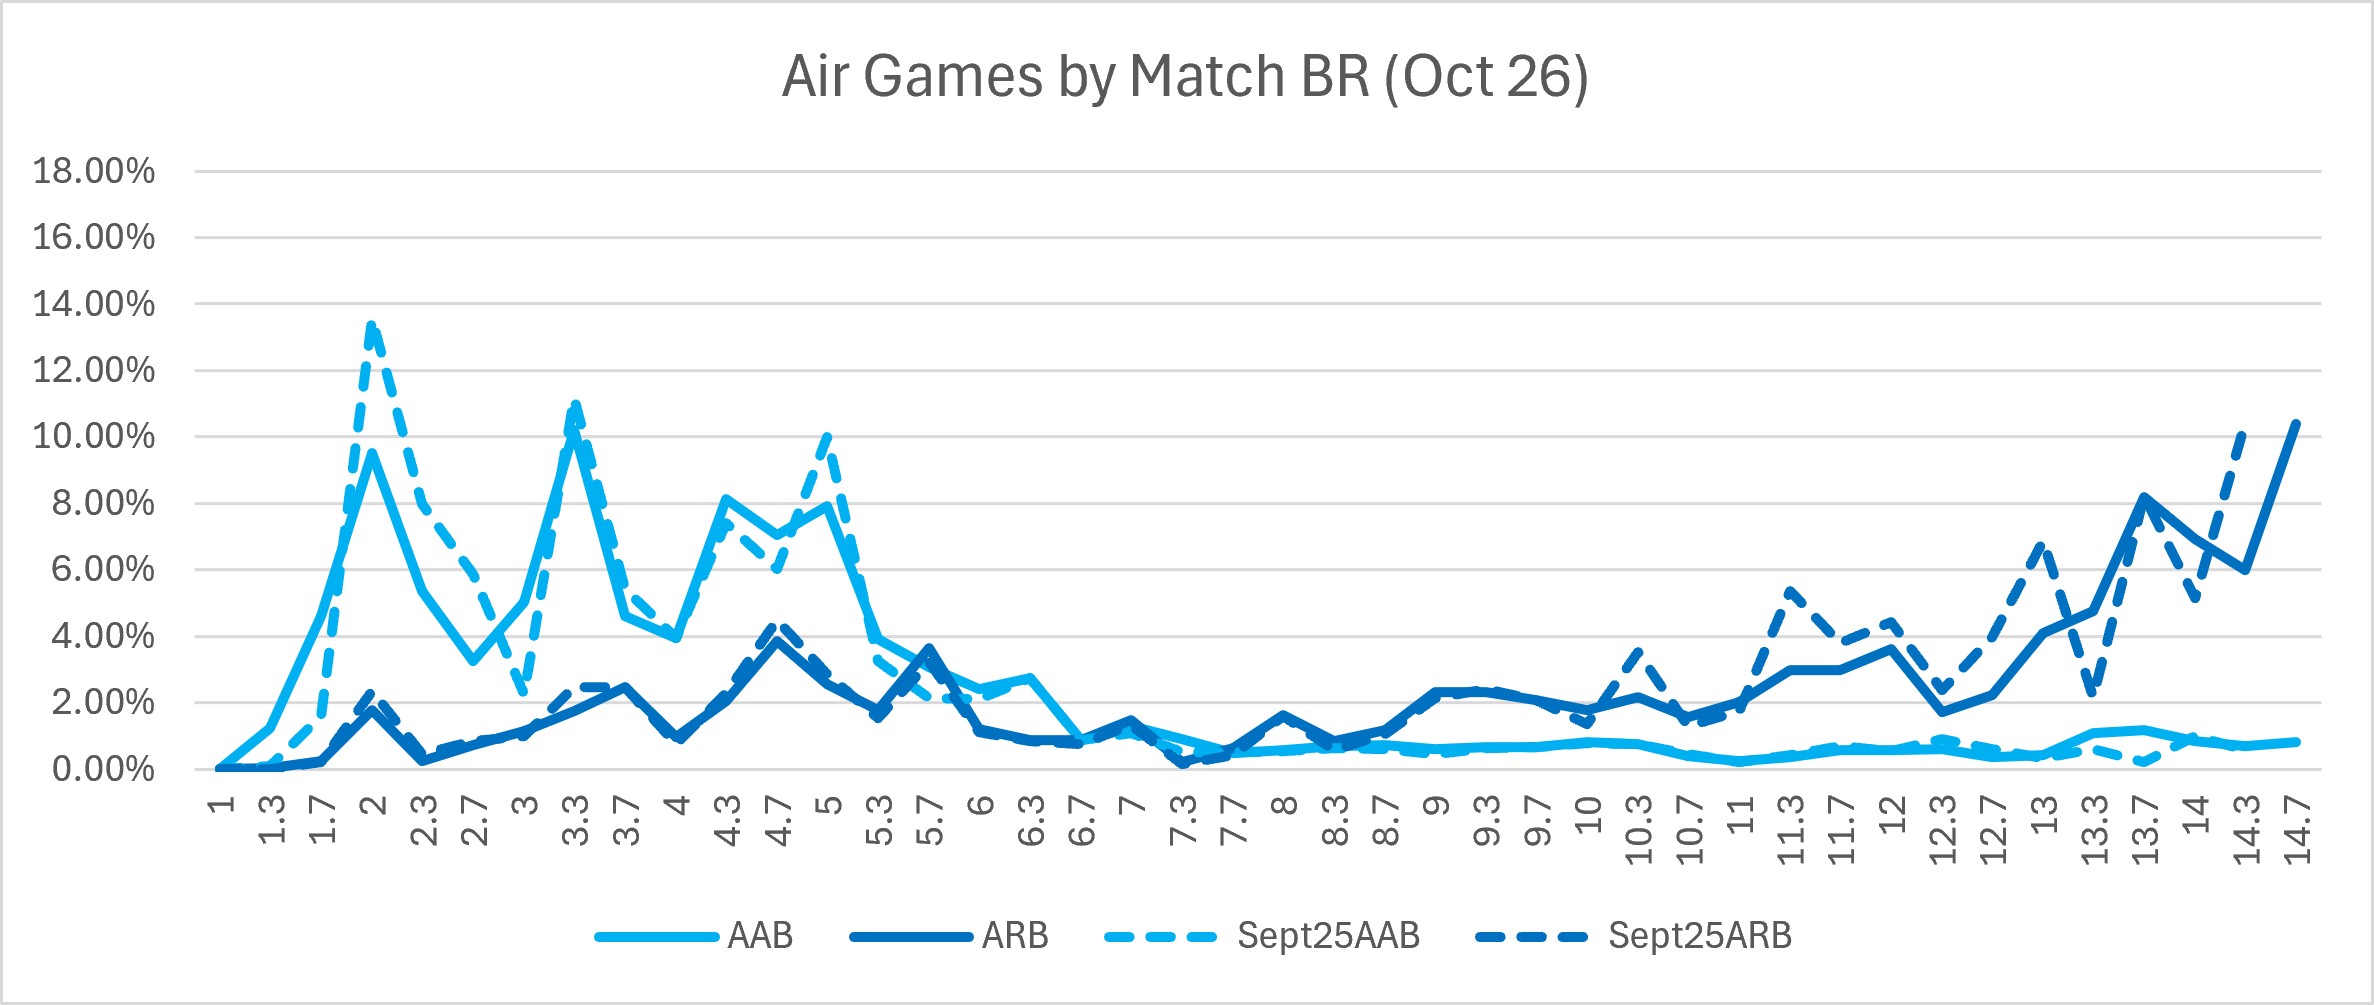
In both Air and Ground modes, Realistic battles are more common at higher BRs, and Arcade battles are more common at lower BRs, although the effect is more pronounced with Air AB vs RB. Actual top tier matches continue to be about 10-12% of the ground and air RB modes, but there are still lots of games at all BRs in ARB, GRB and GAB (AAB is the exception here).
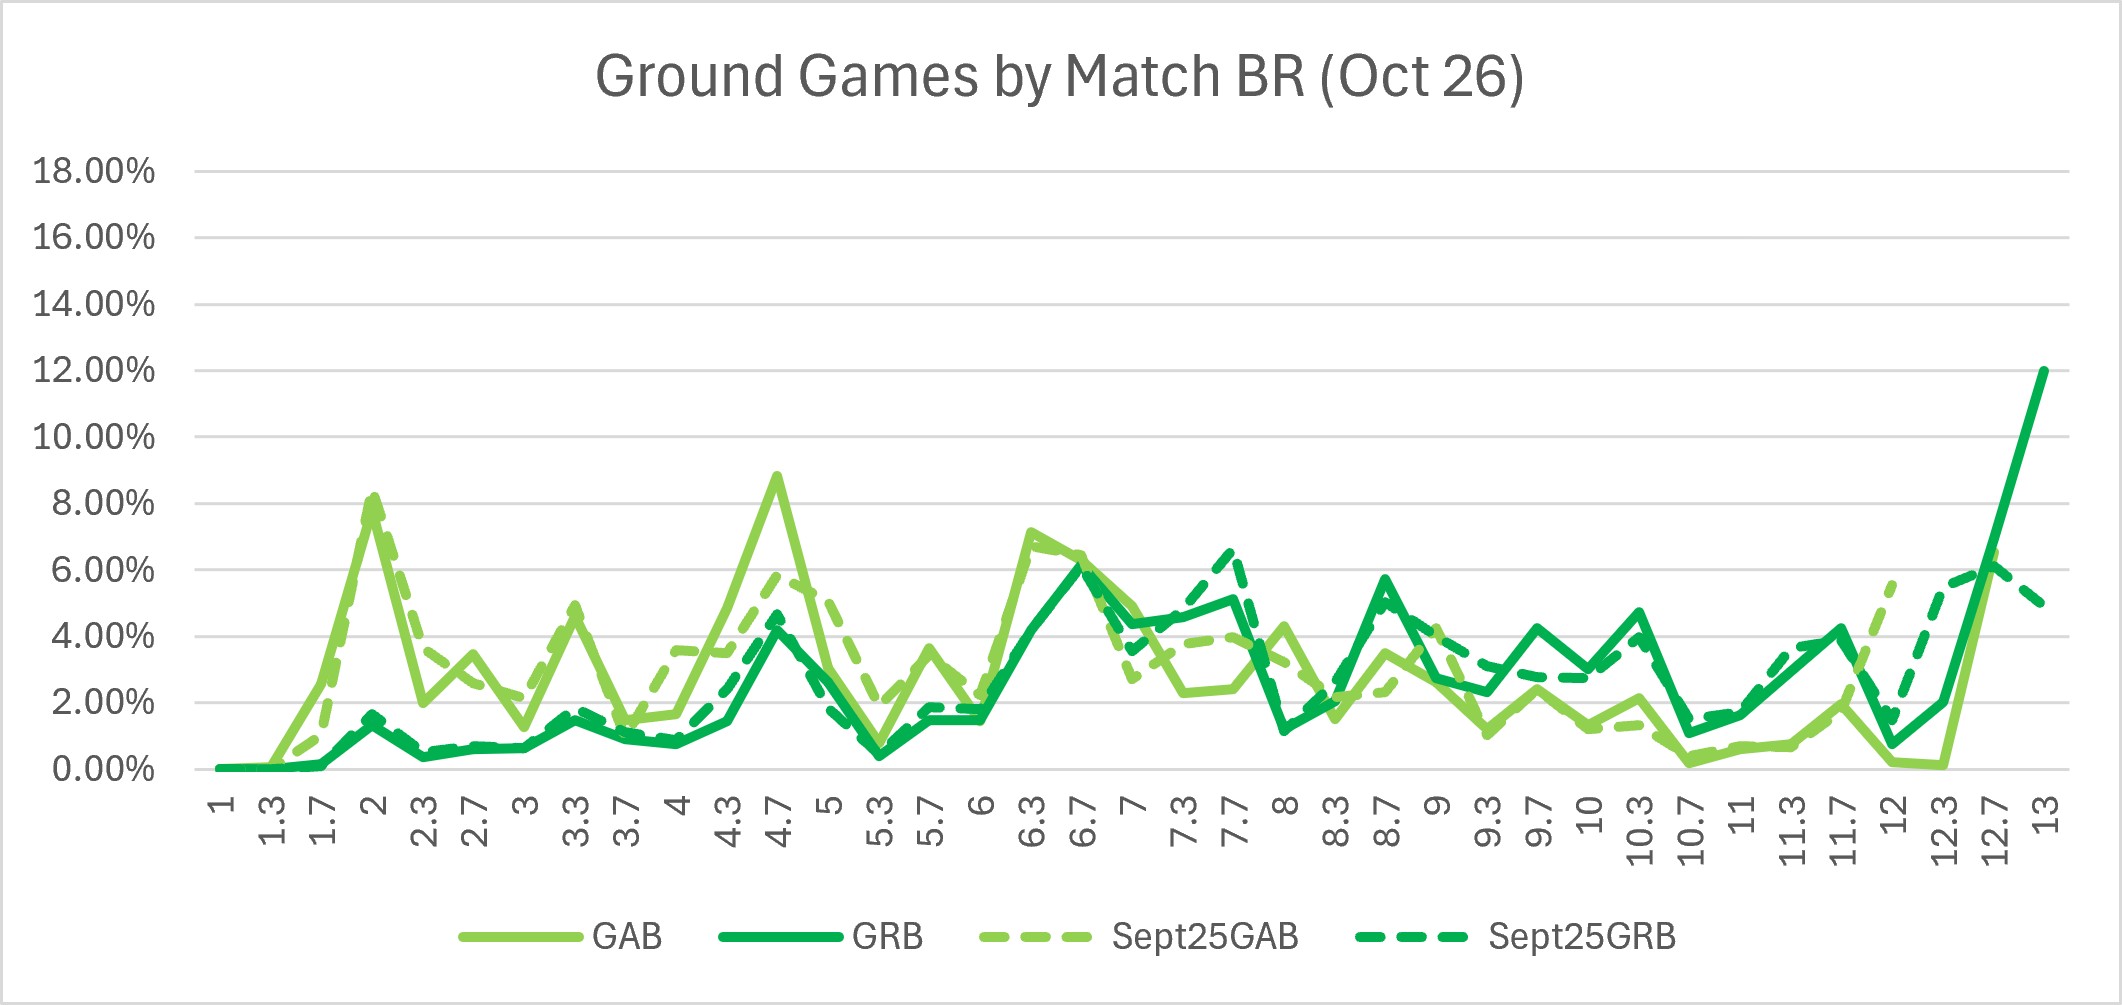
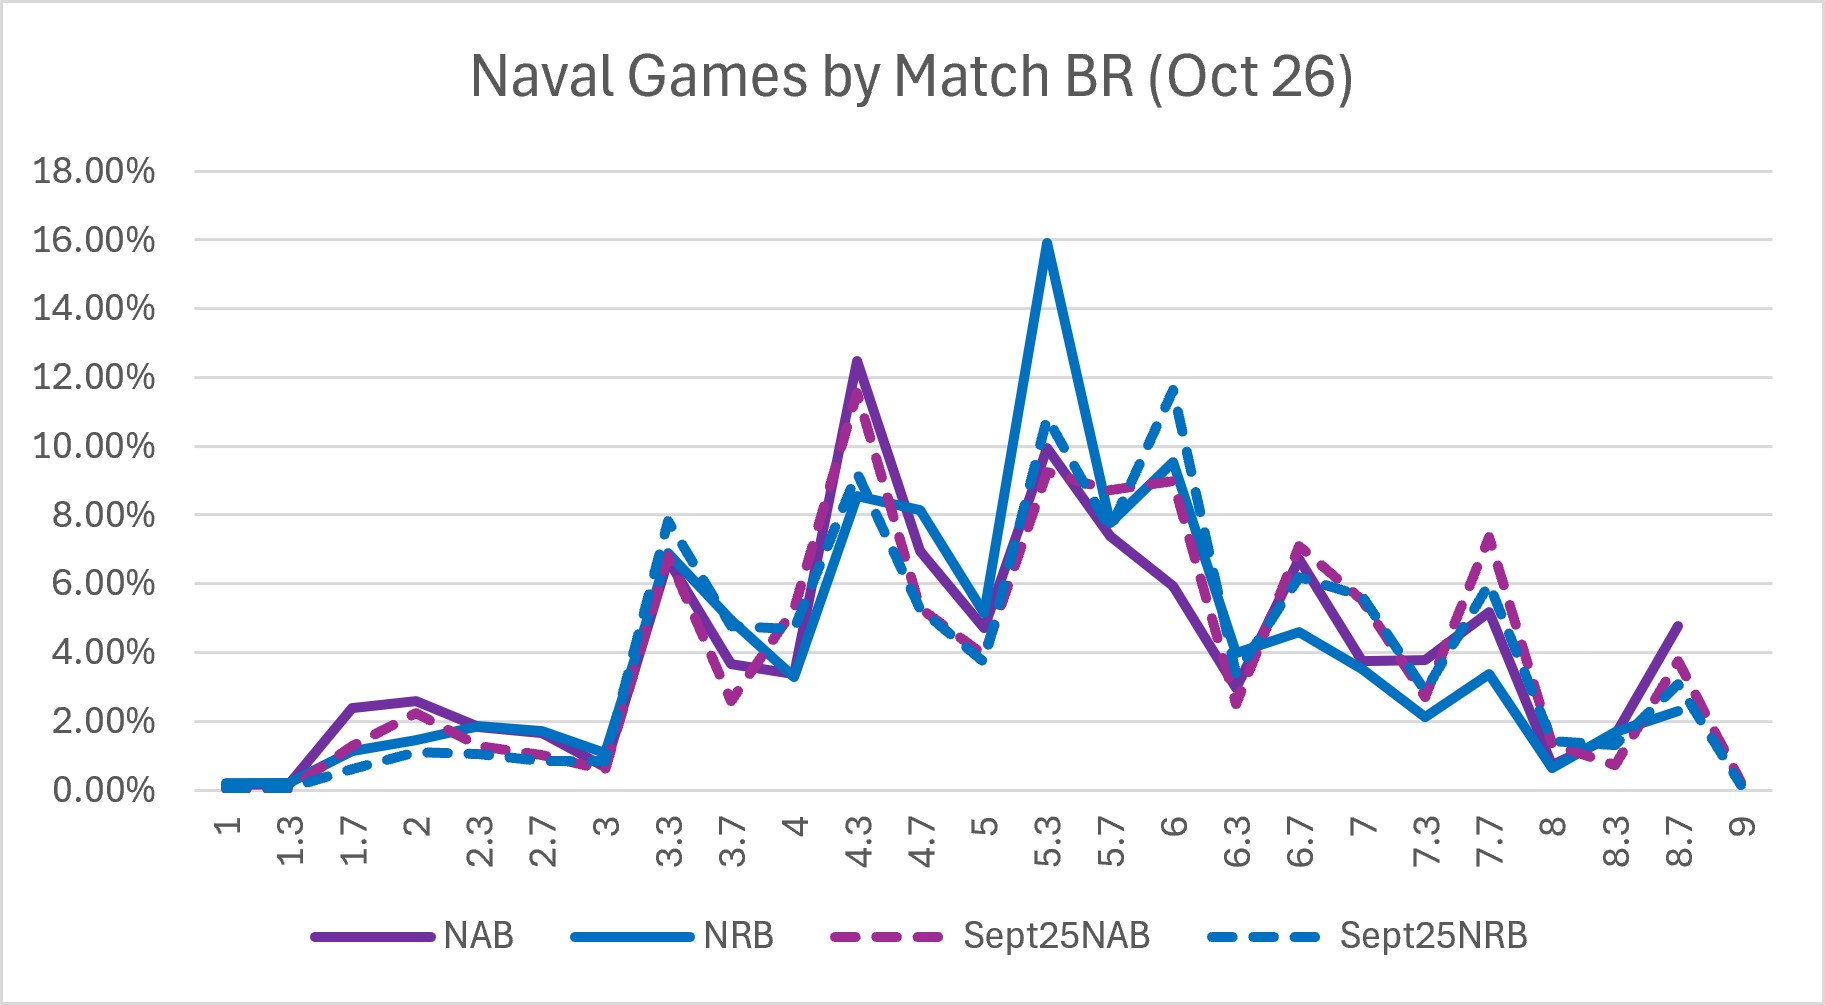
In Naval, whether AB or RB, the peak interest continues to be in the midrange, with AB players peaking out around BR 4.3 and RB players around 5.3. Interest in games below BR 3.3 in either mode (ie the purely coastal BRs) continues to be very low by comparison to the BRs with bluewater ships available.
What are my chances of an uptier?
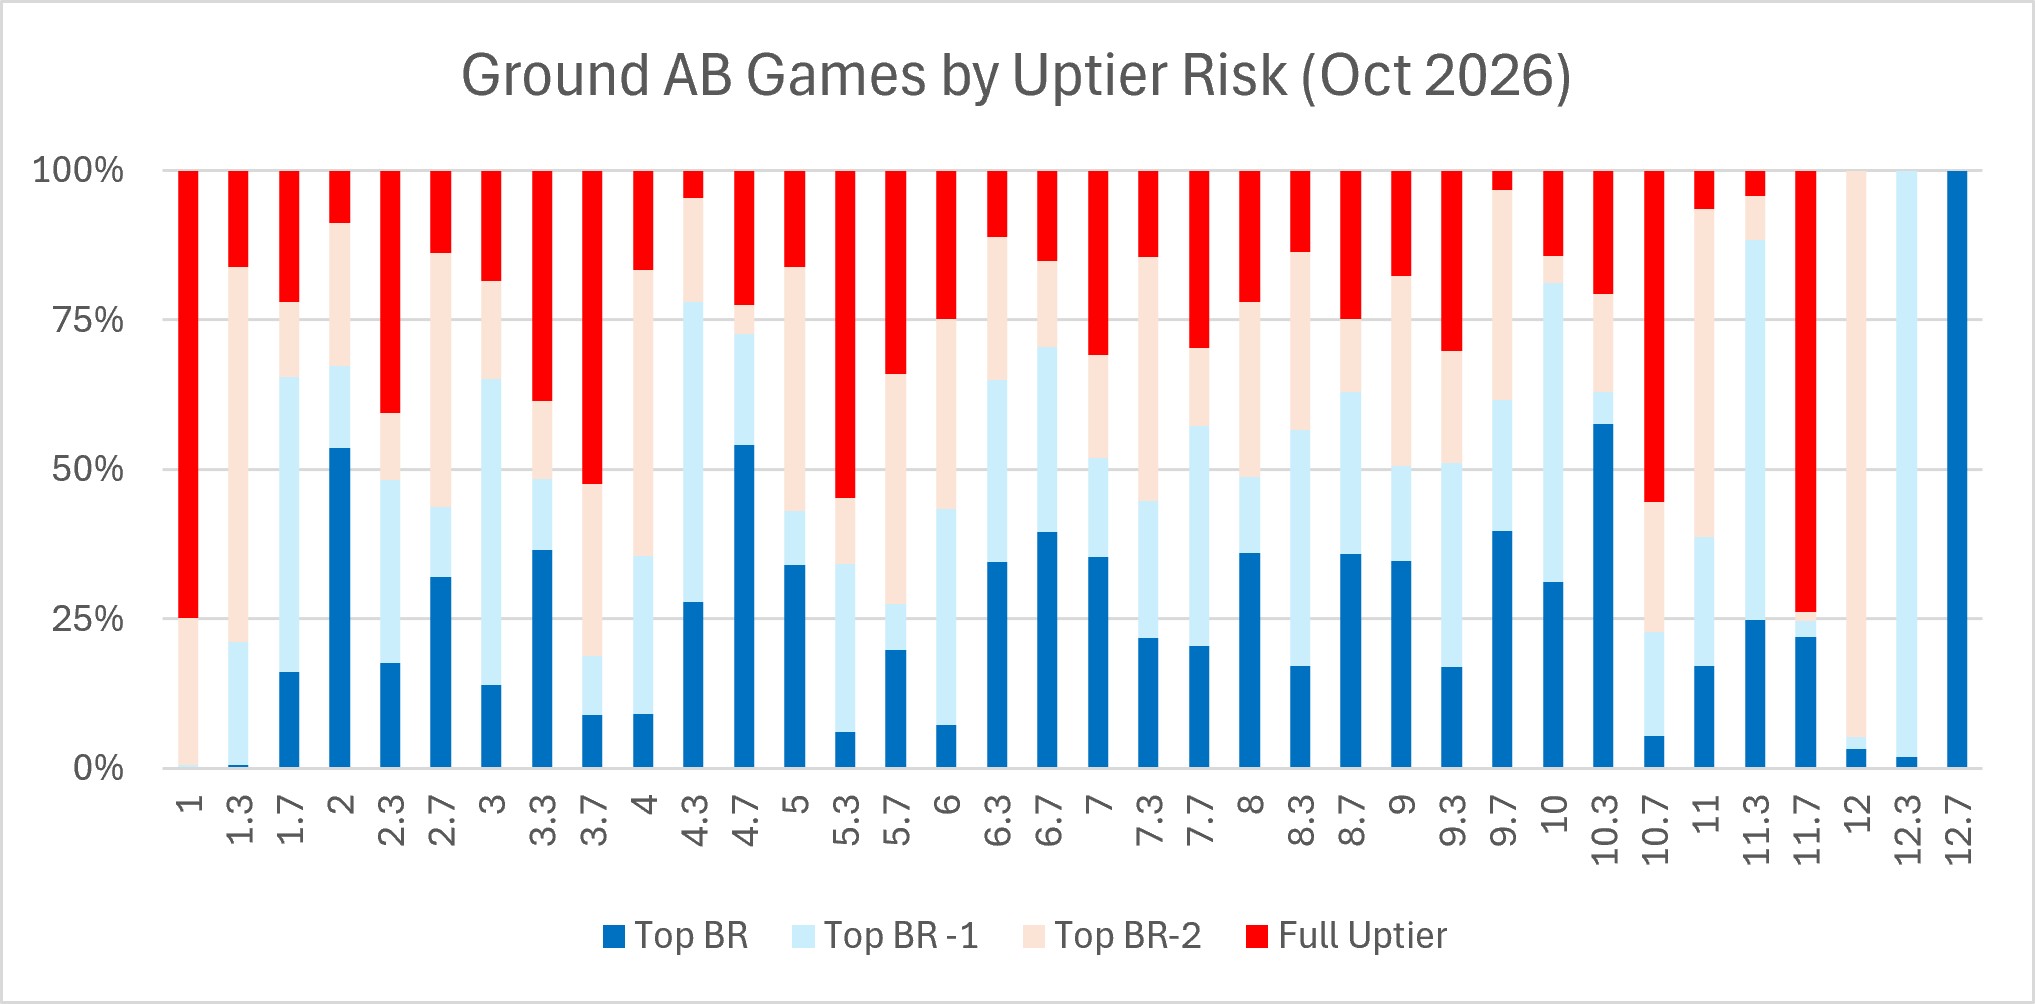
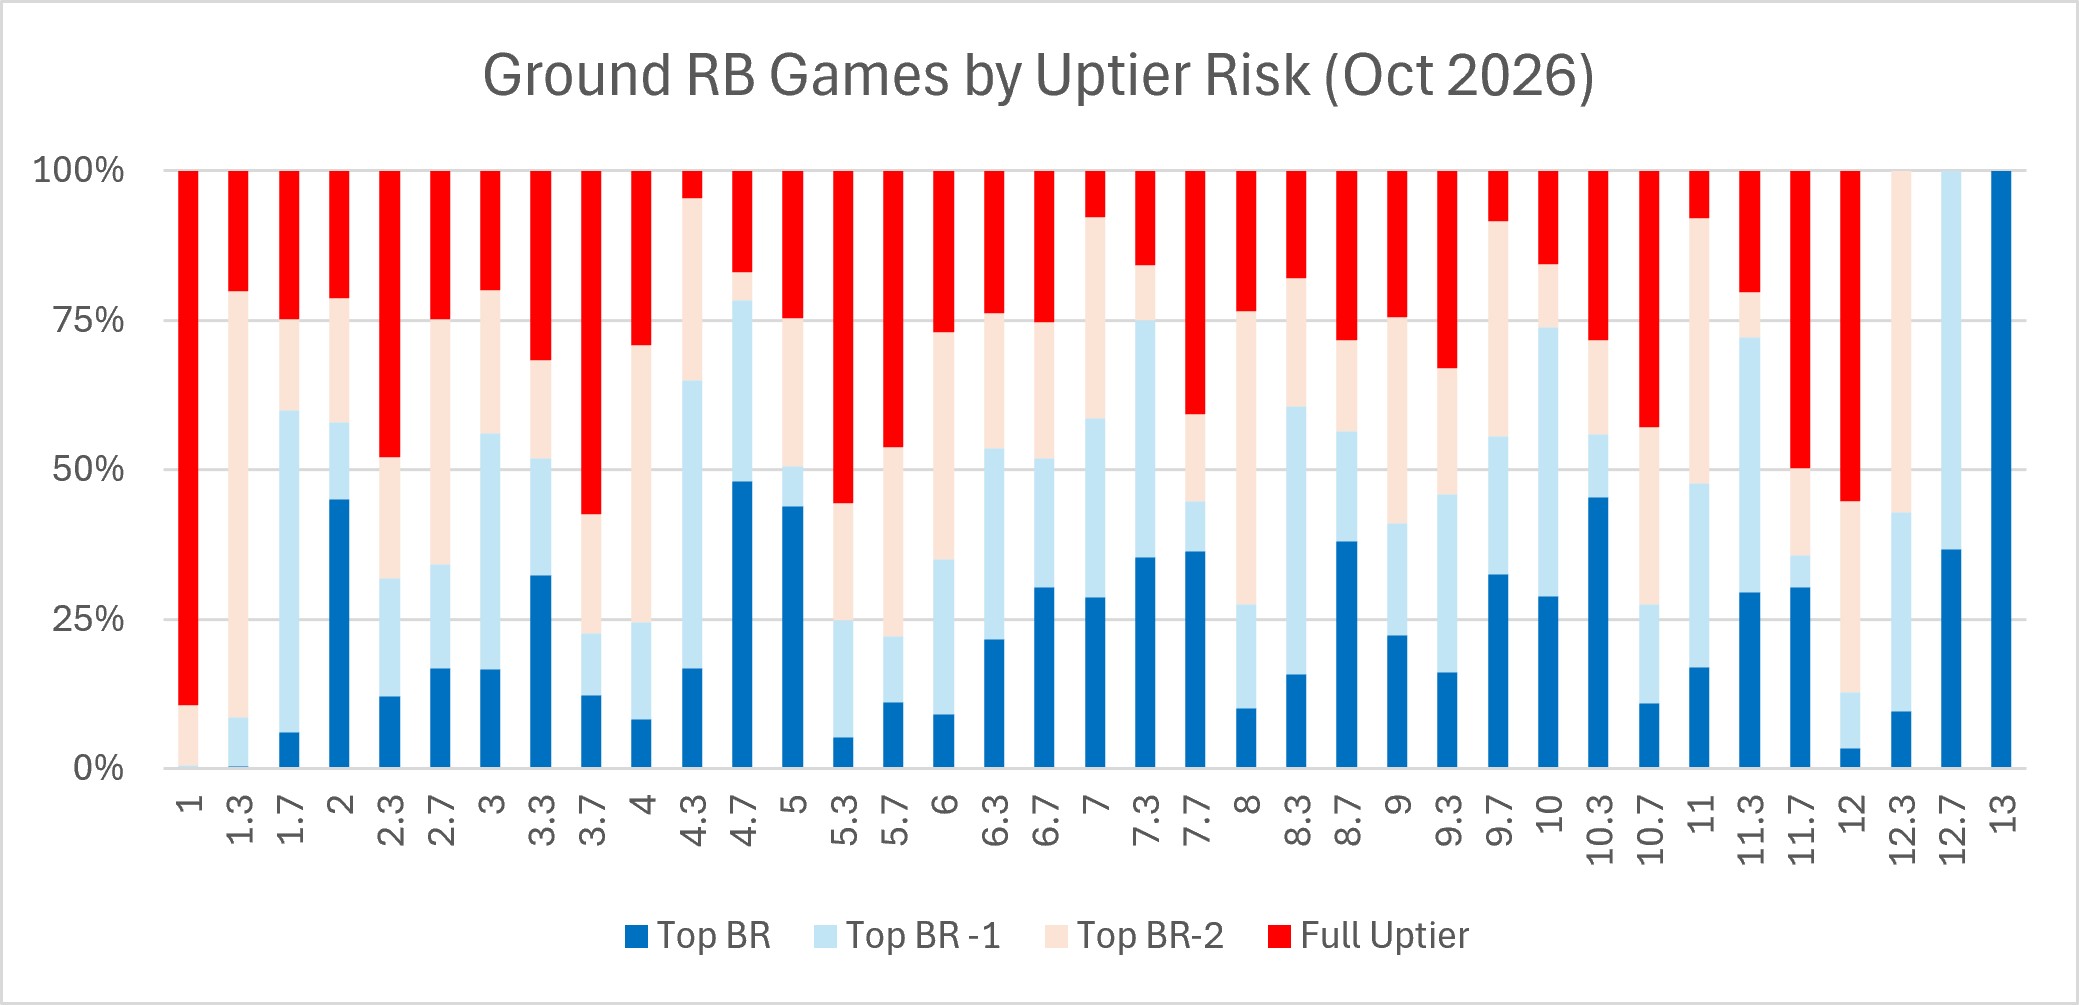
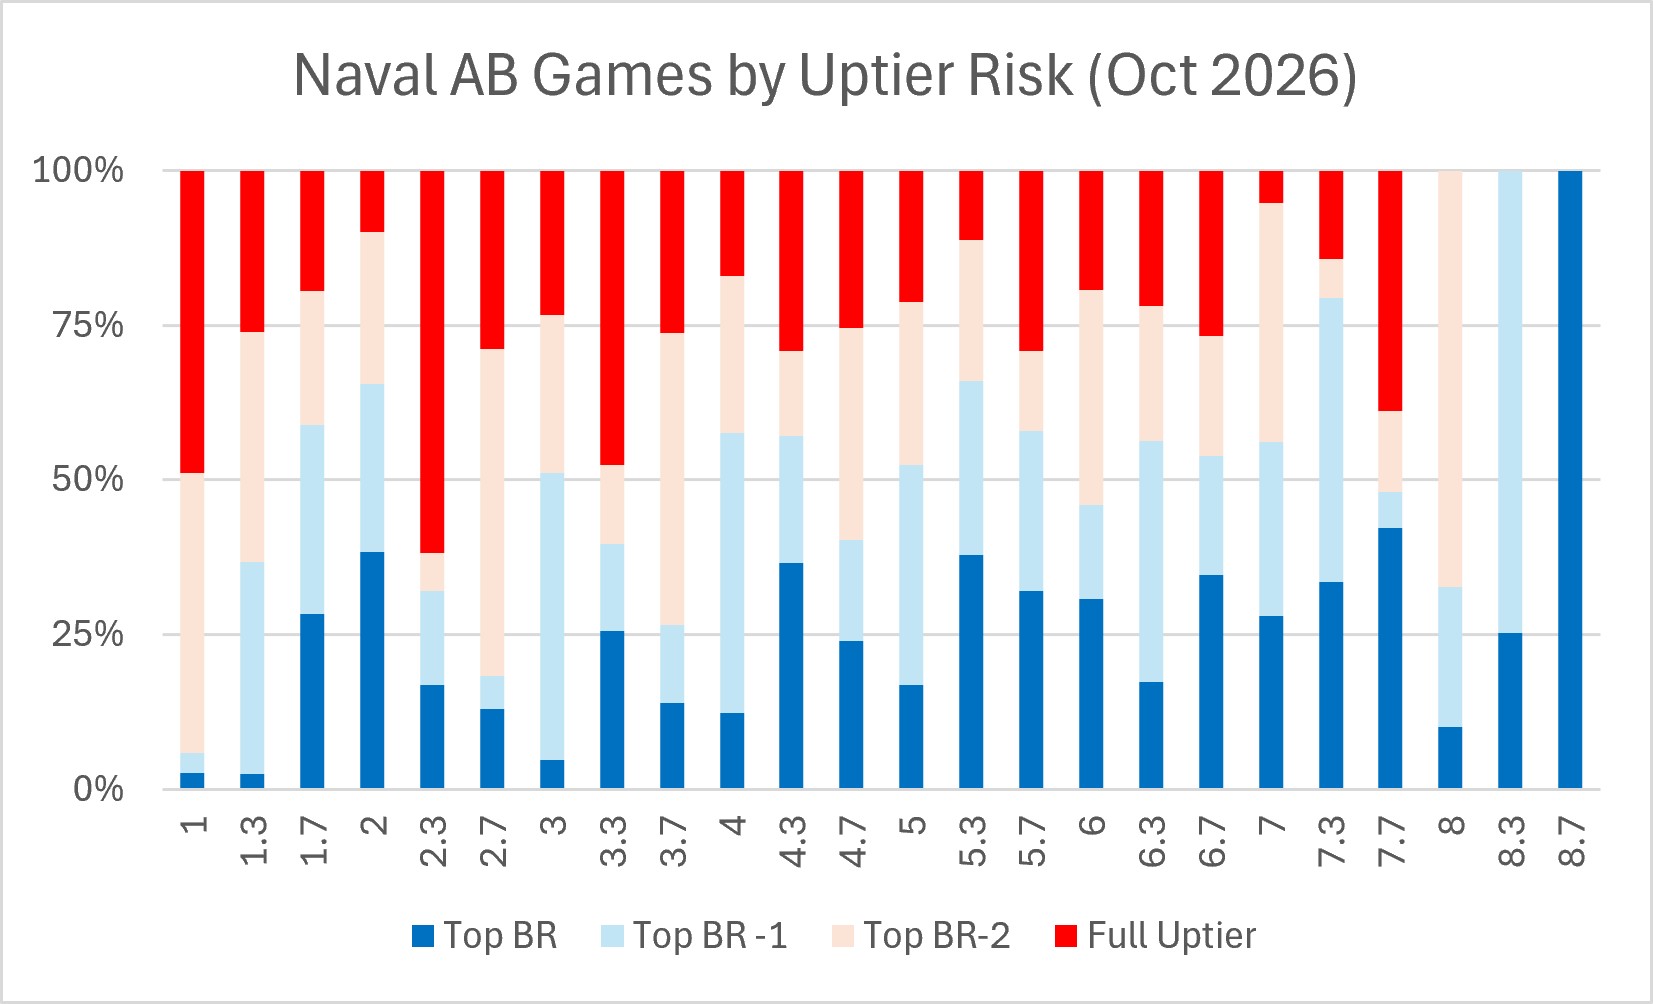
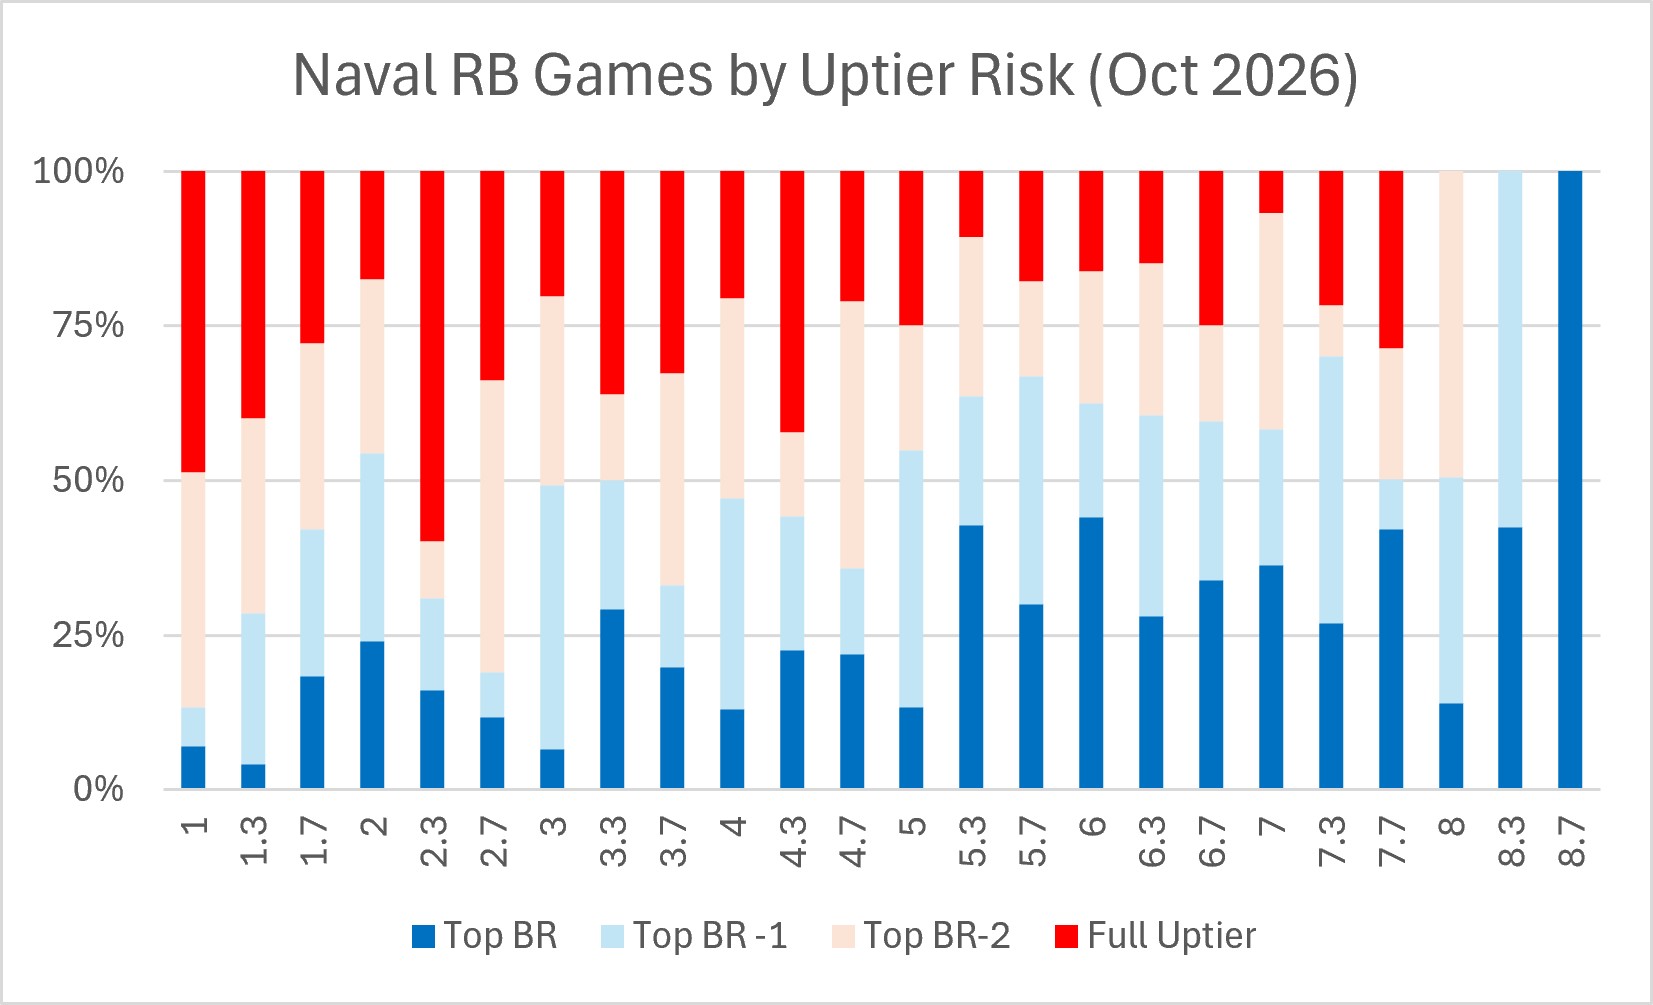
People always feel they get more uptiers than they deserve. Having access to these stats again gives us a better idea which lineup BRs carry a higher uptier risk. I’ve tried to show them here in a way that shows the risk more clearly. In a perfectly balanced game, every section of the column for each BR would be one quarter of the total (25%). Red below the midline shows a strong chance you’re going to be facing vehicles 1 BR higher than your own. Blue above the midline shows the reverse, that you’re more likely to be tops.
With Air AB, of course there is a trick where you can lower your BR by one step. There’s no way of knowing in October how much this was used from these stats. Air modes overall however seem fairly balanced.
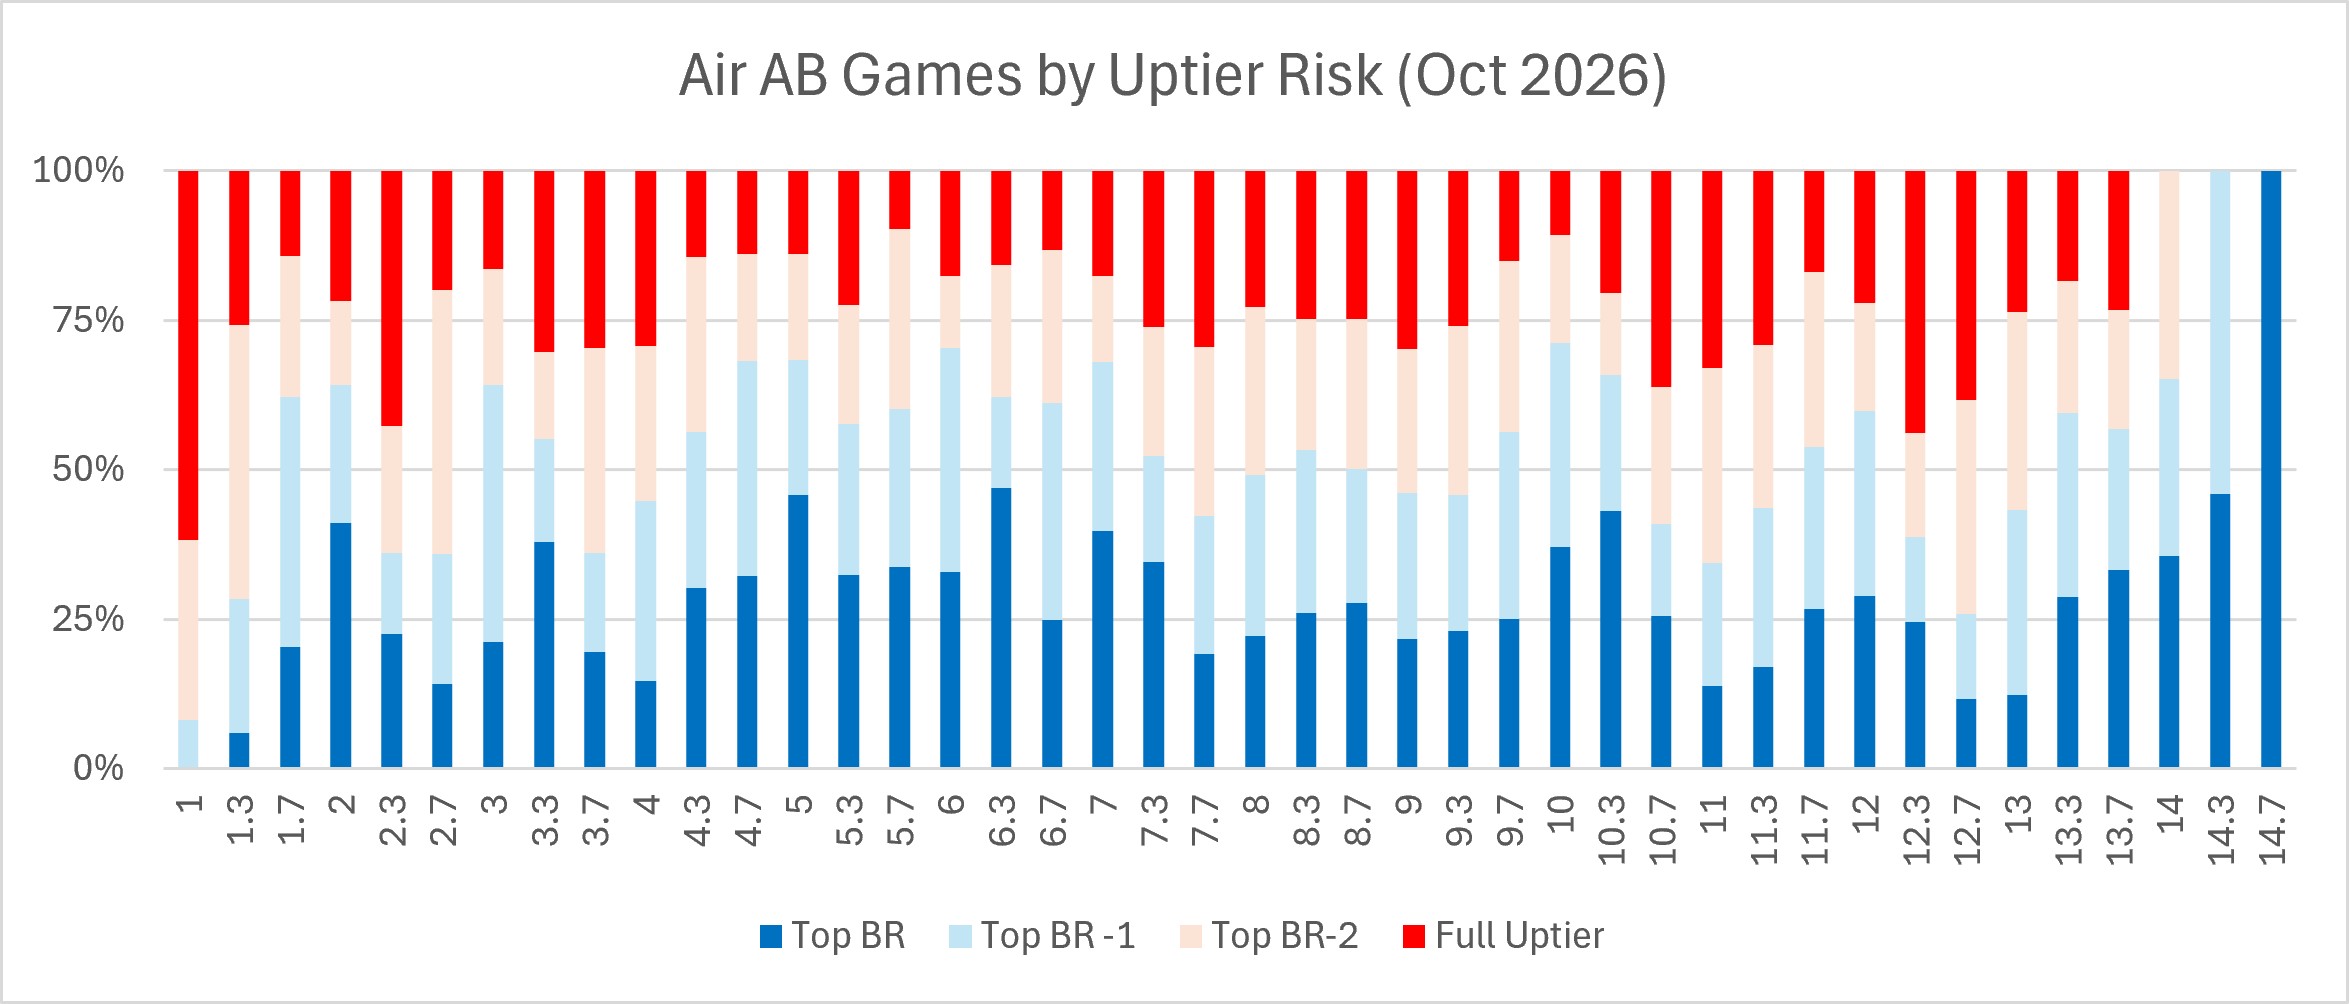
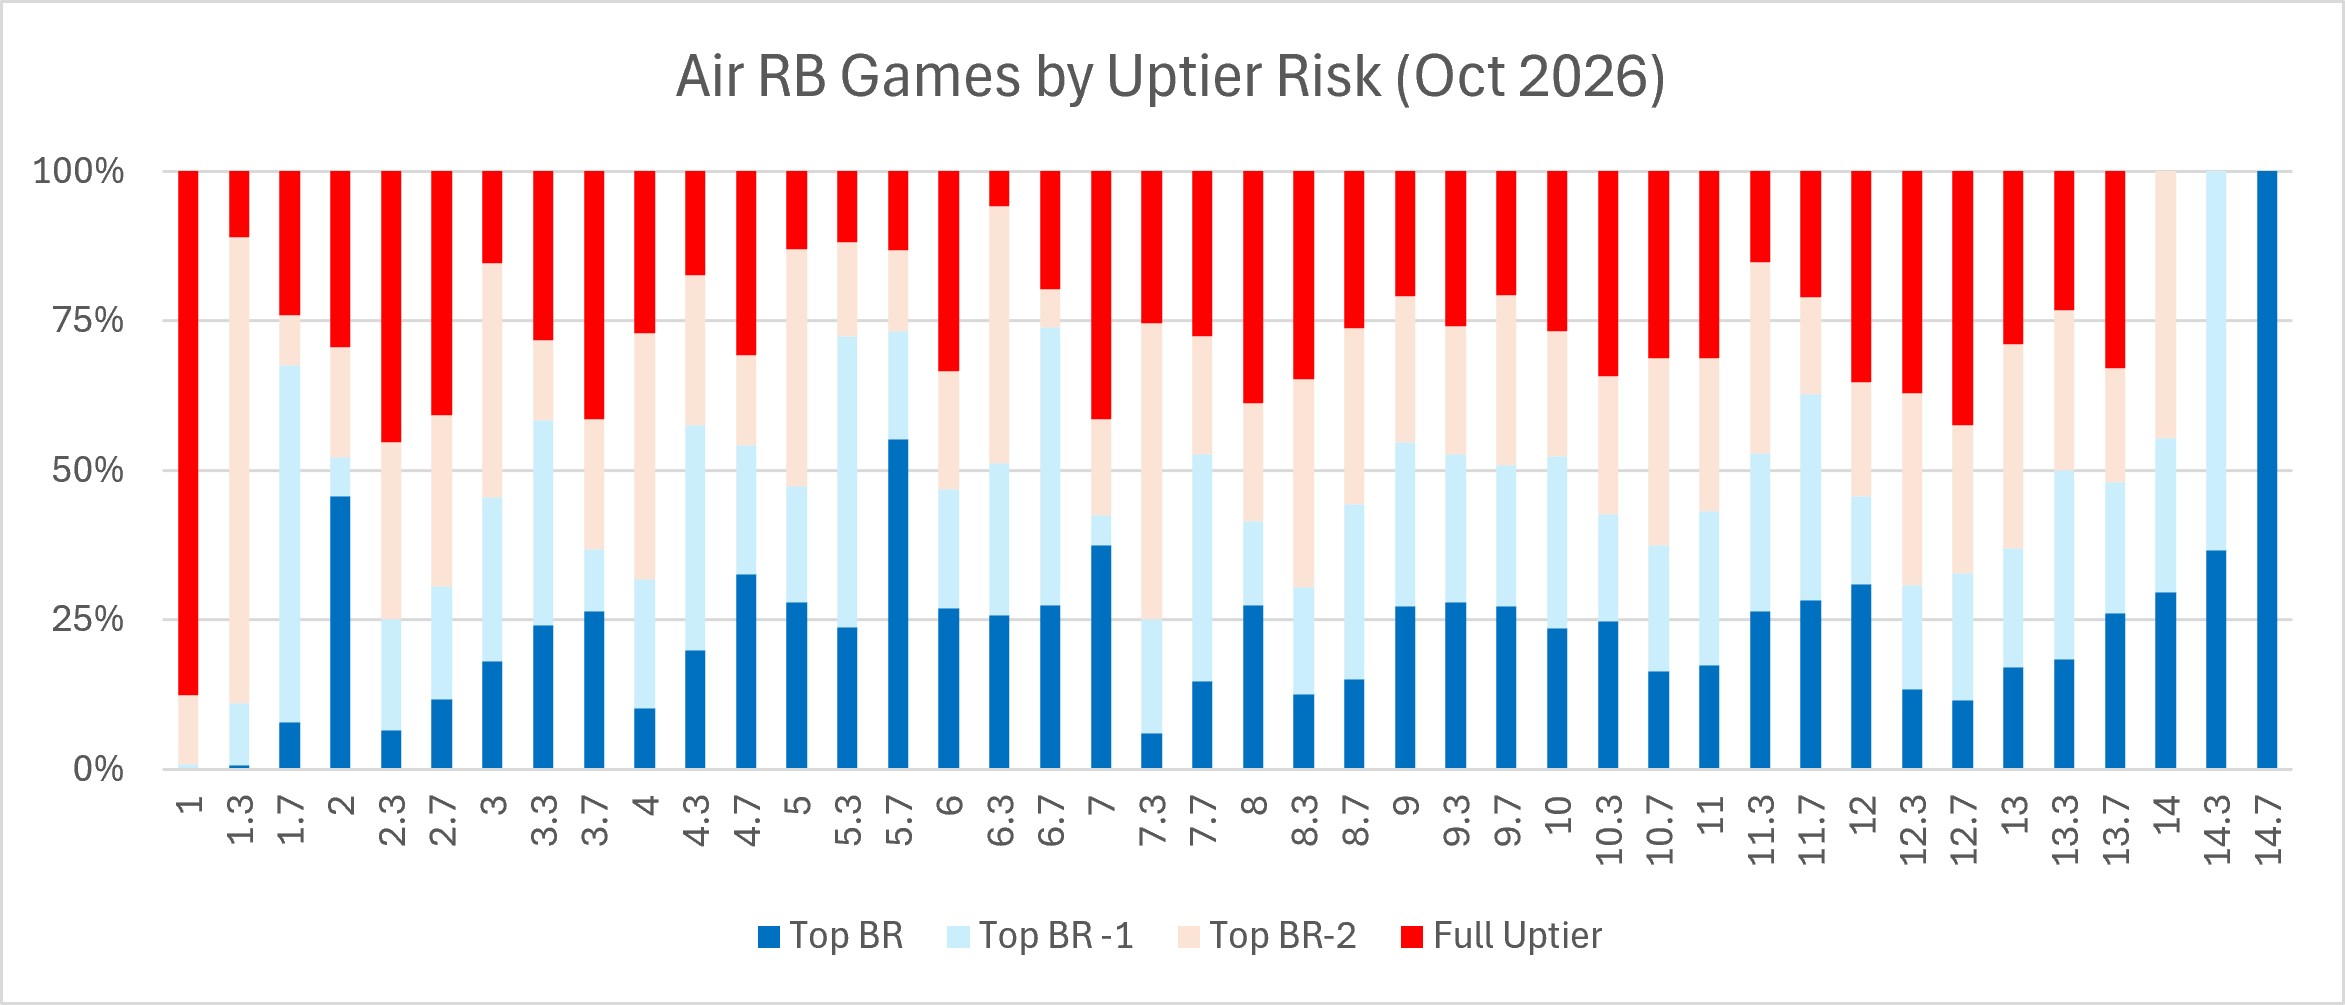
In ground modes, there’s more variation with strongly favorable BRs in October at 4.3-4.7 and 10.0-10.3 in AB (and really bad uptiering risk at 3.7, 5.3 and 10.7). In Ground RB 4.3-4.7 was also strong, but so was 7.3, 10.0, and 11.3, with 3.7-4, 5.3-5.7 and 12 having very high uptier risk.
In naval, you want to generally avoid 2.3 (no one likes fighting 3.3 destroyers in 2.3 coastals much) but 8.0 in AB is also a little rough right now (not so much 7.7 though).
Summary
It’s great to have this data back, although obviously would be better if Gaijin provided it themselves rather than a third party. Kudos to Statshark for bringing it back, and I hope they keep it up. It shows a game that is overall at least as healthy as a year ago and one which is changing with some nations becoming more popular (China, Italy, Israel) and others apparently somewhat less (Germany, France).
Obviously if this continues for a while longer we could have a very interesting data set that will help us to understand whether War Thunder is growing, and in which modes, and Statshark gets all the credit for that. Open questions I have that I think would be fun to hear people’s thoughts on would be what happened exactly in the Air SB modes over the last year, as well as exactly which submodes like Naval EC or Nuclear Escalation are able to captured in these stats, and whether including those just as regular games here would makes those stats better or worse. Obviously, counting 1 “player game” whether a game is 15 minutes long like a regular naval battle or air match or possibly a couple hours like a full Naval EC or a nuclear escalation match without any additional differentiation in the data could be skewing some data for some vehicles, BRs, even modes. It would be great to see more clarity from Statshark on what exactly they can cover this way and what kinds of games and events are getting completely left out. Another idea would be for Statshark to start putting up uptier risk graphs like the one above, rather than the somewhat useless player count chart: personally I’d find that a more useful resource in lineup selection in a couple different modes. But if they keep this going to March 2027, that could give us a two-year comparison with March, 2025 (I think their first attempt in February 2025 looks like it missed some data, so March would be the target here) which could have some new insights on game health as well.