Data Analysis #7: The AzimuthZero data: the good, the bad, and the interesting

Another really interesting data set on War Thunder battles emerged this week, from data scientist and player AzimuthZero, which he put together to sort out the question if War Thunder’s population is declining or losing interest. It’s a good video, which players should watch, and I think the overall conclusions about game health are sound and similar to conclusions that have been drawn by me and others multiple times before.

AzimuthZero attempted to make up for our lack of good overall War Thunder player data in a new way, responding to a bit of a data drought we’ve had since StatShark stopped doing overall player counts last September. His approach was to randomly choose replays and then do player queries on all the players in the replays. Barring another data leak like StatShark used, this is probably the best method we have left. While there was a flaw in the method, which I’ll go into, one that makes some of the conclusions unreliable, AzimuthZero also made his dataset publicly available, which is really commendable as well. And there’s some interesting conclusions to old questions one can still draw from it, which I’ll be looking forward to using here. (AZ also describes his method in detail, which is really great because it made it easy to figure out the reason for the data discrepancy between his and previous data sets. Good data science practice all around.)

Basically the method attempted to randomly pick 10,000+ games from the replays and then make a list of all 200,000+ unique players who were in those games to look at their individual stats, to see if they had been around a long time, if experienced players were playing less. etc. If you played a game in the collection period (June 24-July 2) there’s a pretty good chance you’re in there.

1. The Problem

Unfortunately, the method chosen to pick games here was NOT actually random, leading to the games being strongly overweighted to the Air RB and Ground AB modes, at the expense of Air AB and Ground RB.

The reason for this is really volume. War Thunder creates a LOT of new games every minute. And the list of games you get when you refresh the replays home page he was using to pull the sample is NOT in fact a representative sample of all games created. Air RB and Ground AB are overrepresented in that list, and the other modes underrepresented.

We can prove this by taking any minute of time, counting the games that show up on the replay homepage each mode (which is what AzimuthZero’s sample is drawn from) and compare it to the actual number of games created in that minute for each mode by drilling down farther in the replay site.

I did this for 16:58 UTC on July 31. Here’s the summary of all the games in that minute on the home page (from the same game list AZ would have drawn from):
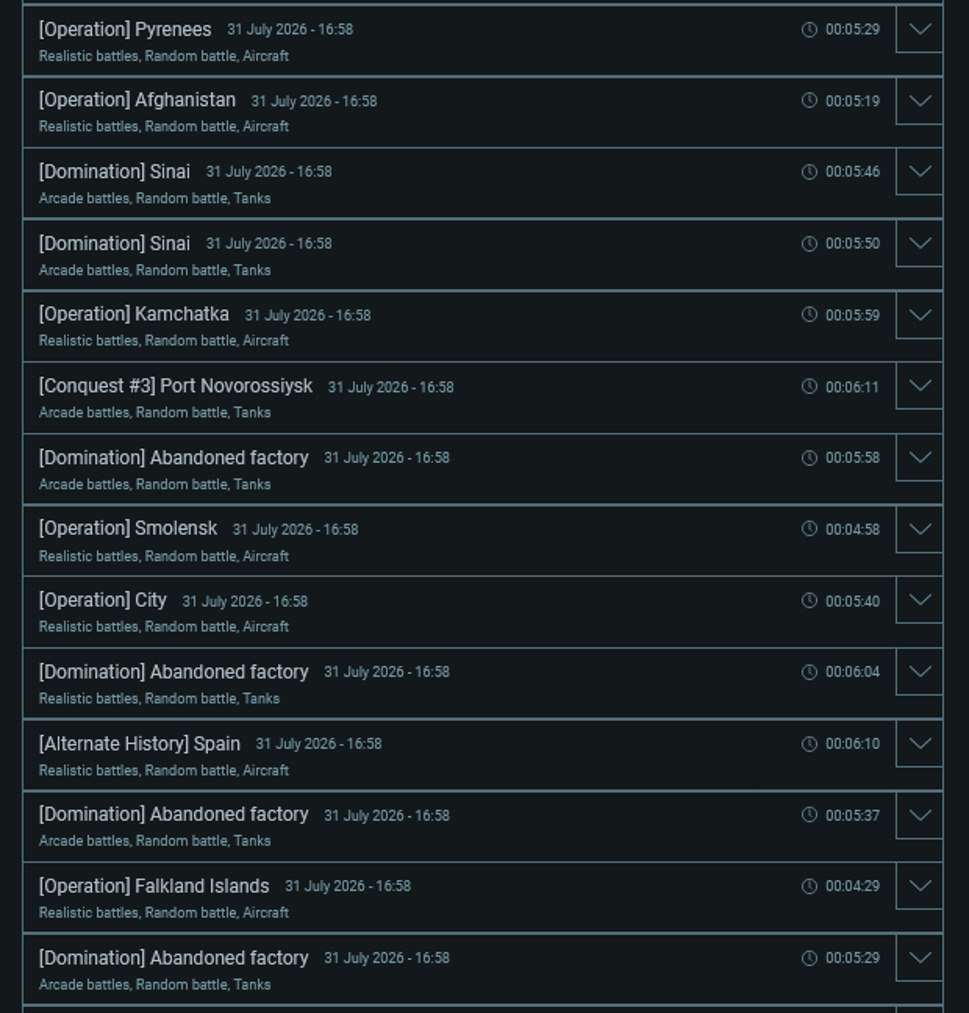
Spoiler

Seven ARB, six GAB, and one ground RB were all that made the home page on that pass. But how many games WERE actually created in that minute, taken if we drill down and count all the games with that time stamp on the submenus?

Mode Games
Naval AB 3
Naval RB 3
Air AB 19
Air RB 40
Ground AB 54
Ground RB 133

Yes, that is accurate (you can check this yourself with this one minute I used, or any other minute’s worth of results on the home page compared to the actual numbers of games on the subpages for that same minute… they’re all similar). WT creates over 200 new games a minute when player count is high. For whatever reason, the replay home page only lists a few of them, not in overall chronological order, and the weighting toward ARB and GAB in the ones that get listed on the home page is notably skewed (this weird sampling bias also exists when you select more than one combination of game mode using the checkboxes on the search menu, too). You’ll get different results for each minute of course, but the overall effect on this kind of sampling method will be the same: Over 50% of actual games will be GRB, but very few of those make the homepage, or a sample of the games on the homepage the way it’s being pulled here, so your sample will not have anywhere near the right number of games from the most popular mode.

So this unfortunately means for AzimuthZero that his conclusions about relative popularity of player mode are just wrong. There were ways to check for this error, of course, like doing the method I just described to figure out if the homepage was generating a randomized sample of all modes, or checking against known stats for the proportion of modes to each other like 2025 StatShark data. I do hope he or someone else comes up with a better method to counter that bias on the next try.

For now, the best evidence we have on relative popularity of the various modes is still by counting the number of “player-games” from Sept 2025 on StatShark, which is relatively consistent proportionally with the number of games in my sample from the replay page, above:

Mode %Games
Naval AB 2%
Naval RB 1%
Air AB 8%
Air RB 19%
Ground AB 19%
Ground RB 53%

2. So what?

So what does this mean for the rest of AzimuthZero’s conclusions? Well, it means he’s overweighting ground arcade and realistic air players in his sample by about double their actual numbers in the population, while underweighting arcade air players by about 50% and players of the actual most popular game mode, realistic ground, by about 80%. This could well have some impacts down the line on his conclusions, so viewers should keep that in mind when they watch the rest of the video. Overall though, I suspect a lot of players multiple modes (if only sometimes AB and sometimes RB) is going to offset that a bit, which is why I think his overall conclusions about the player base health based on his 200,000 player IDs, which is what he said the main aim was are likely still pretty sound (but not his analysis on BR brackets and match lengths by specific mode, those are broken too for another reason; see below), even if the relative mode popularity numbers he came up with here are not reliable.

But what else could we draw from the data set, given that he’s been so nice to share it? Oh, there’s some fun stuff in there, which we’ll get into here next, in a followon post.


4 Likes

3. Using AzimuthZero’s data to answer some old questions

So even though there are problems, AzimuthZero has produced a full set of game results for 2030 random GRB games, 4200 ARB games, and 3354 GAB games. And that’s a good set to draw some new inferences about old questions. The overall player set of 200,000-ish active players he pulled, while clearly skewed away from ground players, also can tell us things.

A. What time of day and weather in-game is the most common?

For starters, we can look at the number of games in each of the three modes with a good data set by the time of day and weather in the game itself:

Environment GRB ARB GAB
day 77.5% 55.6% 85.9%
morning 4.7% 8.1% 2.7%
noon 13.0% 15.7% 8.5%
evening 4.3% 7.5% 3.0%
dusk 0.0% 6.6% 0.0%
dawn 0.0% 6.5% 0.0%
Visibility GRB ARB GAB
thin_clouds 16.6% 20.8% 15.3%
cloudy 17.8% 20.9% 15.3%
poor 4.8% 0.1% 3.3%
hazy 13.9% 19.4% 14.9%
clear 3.4% 0.0% 6.8%
cloudy_windy 15.0% 18.3% 10.1%
good 23.9% 20.5% 31.4%
thunder 2.1% 0.0% 1.1%
rain 2.5% 0.0% 1.8%

No one’s ever really collected that data before, so that’s an interesting little tidbit. (Interestingly, 11 out of the 2030 GRB games were night games, if you’ve ever wondered how popular THAT was now.)

B. How many active players were in squadron?

While the sample is skewed away from ground RB and toward air RB, it’s still a notable observation that of 205,557 unique player IDs scraped, 56.8% were in a squadron, which is another number it’s been hard to get at before. Knowing how nearly half of the player base still hasn’t joined a squadron gives a sense how strongly squadrons are currently incentivized.

C. How many players played squadded and how much advantage did it give?

Again… sample is a little skewed away from GRB and toward ARB. But… of all games that were captured, 17.5% of the players were playing squadded with at least one other person (not auto-squadded). That’s actually higher than I would have guessed, personally.

How much advantage did it give? The average score for games for someone who was squadded was 817. Unsquadded, it was… 791. So, only about a 3% advantage in score if you squadded up in this sample (note, not winrate, just raw score). That’s actually lower than I would have guessed.

D. How many bots are there in naval?

The naval sample is rather small, only 353 games between AB and RB, heavily weighted toward shorter games (see below) so I wouldn’t draw too much from it. There are a couple inferences one could draw about the relative degree of naval bot ratios between the two modes currently, though.

In the 63 RB games captured, the average number of players in the game was 4.4. Since all naval games are 16v16, that means humans formed 13.7% of naval RB teams in this sample, with the other 86.3 percent being bots.

In the 290 AB games captured, the average number of players in the game was 4.0. However, that factors in the Newbie games, which only have human players on one side, and made up 19% of the AB games in this sample. They only averaged 3.5 humans per game. Take them out, that puts the number of players in “real” AB games at…4.1… still a little less in this sample than the number of humans per side in RB. It’s an indication that an old truism about RB, that it had more bots in it than AB (if you wanted to fight bots) is no longer the case in 2026.

Anyway, thanks again to AzimuthZero for making his data set public and allowing us new information about some old questions.

Previous articles in the Data Analysis series: 6 - 5 - 4 - 3 - 2 -1

5 Likes

Thought I’d dig a little more into the question about whether squadding up helps with score, and whether it varies by mode:

Air Kills Ground Kills Air Kills (AI) AI Kills (Ground) Assists Deaths Zones Captured Base Damage Score Missile Evades Shell Intercepts Score advantage
GAB Squadded 0.26 2.01 0.96 1.77 0.26 1143.73 0.09 0.02 9.71%
Unsquadded 0.23 1.80 0.85 1.62 0.27 1042.54 0.06 0.02
GRB Squadded 0.16 1.87 0.78 1.89 0.22 958.82 0.21 0.04 16.64%
Unsquadded 0.12 1.53 0.67 1.69 0.21 822.04 0.16 0.03
ARB Squadded 0.78 0.07 0.18 0.06 0.83 81.15 640.61 1.74 0.04 0.60%
Unsquadded 0.74 0.08 0.22 0.06 0.82 104.34 636.77 1.65 0.04

The three modes are different. In Air RB, there is almost no statistical advantage to being squadded up. You get slightly more kills and slightly less ground attack damage than other players, and on net, it’s less than a 1% improvement on score.

In Ground AB, it’s a little better, but the 10% score improvement is basically the same as the 10% increase in the number of lives per game. Basically squadded players in GAB appear to be respawning more than unsquadded players do, and so they have slightly better stats because of that. This only makes sense… one-death leavers tend not to squad up, so in multi-spawn modes, squadded players should always have more deaths per game, indicating they’re staying in slightly longer on average.

Of the three modes that were broadly sampled here, only Ground RB shows a statistically significant advantage to teamwork. Respawns are about 12% higher for squadded players, as with GAB, but score is 17% higher, and kills are 22% higher, suggesting here, in fact, players that are squadding with each other do see some benefit from the company.

(As I said before, there’s no way to figure out win rates from this data, where I suspect there might be statistical positive effects as well.)

I think that’s probably one of the most significant facts about War Thunder. If it’s not a game where squadding up matters, it doesn’t really matter if you associate with anyone. Obviously there’s both good and bad aspects to that, but it could say a lot about why the game is the way it is.

5 Likes

Thx - always nice to read something based on facts and not on believes.

Even as i disagreed with some of your specific views in the past - i kindly ask you to take a quick look at the latest BR change spread sheet and try to make sense of it (maybe in a separate thread).

As a pure ww2 (prop) Air RB player i looked at those changes and for me they looked like a targeted income nerf by gaijin.

Fully aware of the risk by looking at statistical data (like Apophenia) it seems for me obvious that gaijin tries (as usual) to reduce SL/RP gains of the most effective aircraft, but after playing around with KpSpawn and SL per game data i noticed also a shift of basically all air trees toward premium / event aircraft regarding the top performers in both categories - meaning that gaijin indirectly enforces sales of premium aircraft and trade of event aircraft.

There are just 2 noteworthy examples of this rule: Single engine USSR props and twin engine UK day/night fighters.

I would be interested in your thoughts on this. Thx in advance!

1 Like

Last thoughts on this. You might ask, well are the conclusions AzimuthZero draws about relative game length by BR or games by BR or most popular vehicles any good at least? Sadly no.

The sampling method used here also strongly overweights shorter games, because they’re more likely to be picked than longer ones. AzimuthZero recognizes this at first in his attempt to offset-weight them for his games-by-mode pie graph, but he doesn’t seem to have fully thought through the effects on the overall data sets for each mode later on in the video.

You can find proof that shorter games were favored over longer ones in the sample in the naval stats. You don’t get the average naval game being a 2v2, with 28 Gaijinbots, unless you’re strongly overweighting shorter games. Any naval player knows 2v2 is not the average naval game.

And here the math backs up intuition. We know from publicly available stats (ie, adding up all the vehicle “games played” in Statshark), there were 180,420,798 Ground RB vehicles played in June (thanks to @_Poul for digging that up for me). At ~30 players per game and ~2 vehicles per player, that works out to there being about 3 million actual GRB games on the replay site in June (yes, that IS a mindboggling number, but when you’re starting ~100 GRB games a minute worldwide, that’s what you get… check the math).

Similarly, we also know there were 3,820,699 Naval AB vehicles played in June. If naval was only 4 players per game (or ~8 player naval vehicles deployed per game), as in AzimuthZero’s sample, that would necessarily mean there would have to be nearly a half-million NAB games on the replay site as well, alongside those 3 million GRB games, ,or about 1 NAB game for every 6 GRB games on the replay site. But as we’ve seen, in reality the ratio is at least 25:1 GRB:NAB games on the replay site, so if we could count all the NAB games with replays for June, based on the vehicles-played numbers we’d likely only find somewhere under 120,000 NAB games there. But if it was 2v2 team sizes and 2 vehicles average per player, those replays would account for somewhere around a million of those 3.8 million vehicles that we know were actually played.

That would mathematically make naval arcade games in reality closer to an 8v8 team size on average than AzimuthZero’s 2v2 (which certainly is closer to player experience, I think). It only makes sense that 8v8 games are going to last longer on average than 2v2s, so AzimuthZero’s sample method must be heavily weighted toward picking shorter games. That bias toward short games in the sample will necessarily extend to all the other modes as well.

This obviously means the length of game by BR graph isn’t much use. What you’re really measuring there is the length of shorter games by BR, which doesn’t really tell you much, as you’re systematically excluding a lot of longer games at all BRs and modes.

But it also means the games-by-BR graphs don’t work either. Because all it’s really telling you in that graph is the BR-spread of players in shorter games. If the conventional wisdom runs true, that high-BR games in ground and air run shorter on average than low-BR games, that will also increase the number of high-BR games in the sample above the actual reality, because more shorter games and fewer longer games were present in the calculation.*

(This could also explain why there’s less of an advantage to squadding up in these stats than I expected, one could hypothesize that squadding would have a greater effect in longer games as both teams dwindle down, with fewer players and more opportunities for team work. In a short game, maybe teamwork has a lower payoff than in a long one.)

Just to close this off, this is the game length by mode for the entire data set in seconds. The average game in all subsets was between 6 and 8 minutes long, showing the level of weighting towards shorter games when you use this replay scraping method. (In fact other than 3 realistic ground games, NO games in the sample of 10,000 ran longer than 10 minutes.)

Mode Mean(s) Median(s) Longest(s)
Arcade Naval 409 425 560
Realistic Naval 431 431 541
Arcade Ground 418 433 585
Realistic Ground 476 477 1081
Arcade Air 425 439 575
Realistic Air 399 395 586

*This also means the “most used vehicle” stats aren’t too reliable either. Statshark has the accurate numbers here… the fact the Su-30s premiums are the most common vehicle in short battles is not the same thing as being the most common thing in ALL battles. They’re just tops in Air Arcade here in this video for instance because top-tier AAB games on average are very very short compared to lower-tier ones.

You can also see this in the ground AB top vehicles AzimuthZero came up with. This is the actual list of most played GAB vehicles from Statshark (June stats):

Spoiler

In the AzimuthZero sample, because the sampling method is skewing it to shorter and thus higher BR games, the evidence of the resulting bias should be obvious, I think:

Spoiler
vehicle appearances
us_m1a1_hc_usmc 5385
ussr_bmpt_72 5245
ussr_t_80ue1 5075
germ_pzkpfw_III_ausf_E 4057
ussr_2s38 3982
ussr_bt_5 3760
ussr_bmpt 3719
2 Likes

I can safely say with my average match in NAB that this is usually the case. Very rarely is it a 1v1~5v5 scenario in my matches. It’s almost always 8v8+