Another really interesting data set on War Thunder battles emerged this week, from data scientist and player AzimuthZero, which he put together to sort out the question if War Thunder’s population is declining or losing interest. It’s a good video, which players should watch, and I think the overall conclusions about game health are sound and similar to conclusions that have been drawn by me and others multiple times before.
AzimuthZero attempted to make up for our lack of good overall War Thunder player data in a new way, responding to a bit of a data drought we’ve had since StatShark stopped doing overall player counts last September. His approach was to randomly choose replays and then do player queries on all the players in the replays. Barring another data leak like StatShark used, this is probably the best method we have left. While there was a flaw in the method, which I’ll go into, one that makes some of the conclusions unreliable, AzimuthZero also made his dataset publicly available, which is really commendable as well. And there’s some interesting conclusions to old questions one can still draw from it, which I’ll be looking forward to using here. (AZ also describes his method in detail, which is really great because it made it easy to figure out the reason for the data discrepancy between his and previous data sets. Good data science practice all around.)
Basically the method attempted to randomly pick 10,000+ games from the replays and then make a list of all 200,000+ unique players who were in those games to look at their individual stats, to see if they had been around a long time, if experienced players were playing less. etc. If you played a game in the collection period (June 24-July 2) there’s a pretty good chance you’re in there.
1. The Problem
Unfortunately, the method chosen to pick games here was NOT actually random, leading to the games being strongly overweighted to the Air RB and Ground AB modes, at the expense of Air AB and Ground RB.
The reason for this is really volume. War Thunder creates a LOT of new games every minute. And the list of games you get when you refresh the replays home page he was using to pull the sample is NOT in fact a representative sample of all games created. Air RB and Ground AB are overrepresented in that list, and the other modes underrepresented.
We can prove this by taking any minute of time, counting the games that show up on the replay homepage each mode (which is what AzimuthZero’s sample is drawn from) and compare it to the actual number of games created in that minute for each mode by drilling down farther in the replay site.
I did this for 16:58 UTC on July 31. Here’s the summary of all the games in that minute on the home page (from the same game list AZ would have drawn from):
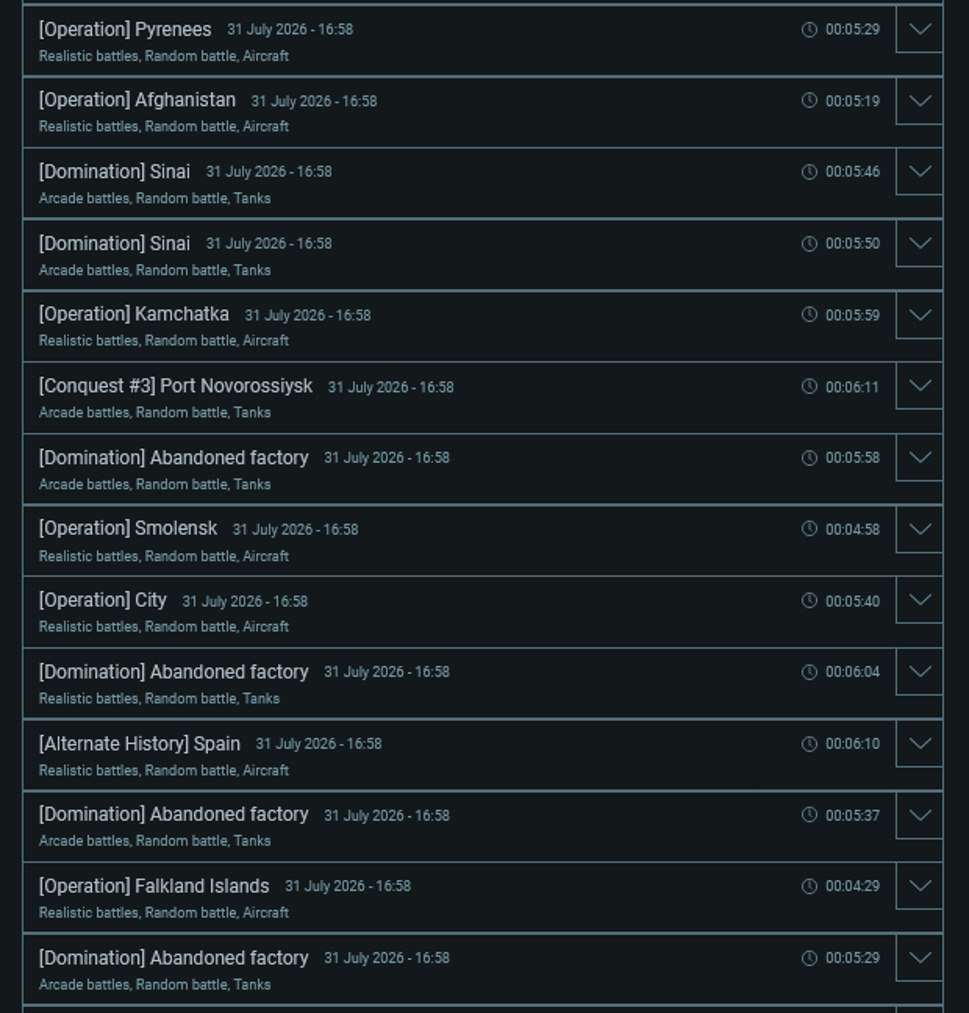
Seven ARB, six GAB, and one ground RB were all that made the home page on that pass. But how many games WERE actually created in that minute, taken if we drill down and count all the games with that time stamp on the submenus?
| Mode | Games |
|---|---|
| Naval AB | 3 |
| Naval RB | 3 |
| Air AB | 19 |
| Air RB | 40 |
| Ground AB | 54 |
| Ground RB | 133 |
Yes, that is accurate (you can check this yourself with this one minute I used, or any other minute’s worth of results on the home page compared to the actual numbers of games on the subpages for that same minute… they’re all similar). WT creates over 200 new games a minute when player count is high. For whatever reason, the replay home page only lists a few of them, not in overall chronological order, and the weighting toward ARB and GAB in the ones that get listed on the home page is notably skewed (this weird sampling bias also exists when you select more than one combination of game mode using the checkboxes on the search menu, too). You’ll get different results for each minute of course, but the overall effect on this kind of sampling method will be the same: Over 50% of actual games will be GRB, but very few of those make the homepage, or a sample of the games on the homepage the way it’s being pulled here, so your sample will not have anywhere near the right number of games from the most popular mode.
So this unfortunately means for AzimuthZero that his conclusions about relative popularity of player mode are just wrong. There were ways to check for this error, of course, like doing the method I just described to figure out if the homepage was generating a randomized sample of all modes, or checking against known stats for the proportion of modes to each other like 2025 StatShark data. I do hope he or someone else comes up with a better method to counter that bias on the next try.
For now, the best evidence we have on relative popularity of the various modes is still by counting the number of “player-games” from Sept 2025 on StatShark, which is relatively consistent proportionally with the number of games in my sample from the replay page, above:
| Mode | %Games |
|---|---|
| Naval AB | 2% |
| Naval RB | 1% |
| Air AB | 8% |
| Air RB | 19% |
| Ground AB | 19% |
| Ground RB | 53% |
2. So what?
So what does this mean for the rest of AzimuthZero’s conclusions? Well, it means he’s overweighting ground arcade and realistic air players in his sample by about double their actual numbers in the population, while underweighting arcade air players by about 50% and players of the actual most popular game mode, realistic ground, by about 80%. This could well have some impacts down the line on his conclusions, so viewers should keep that in mind when they watch the rest of the video. Overall though, I suspect a lot of players multiple modes (if only sometimes AB and sometimes RB) is going to offset that a bit, which is why I think his overall conclusions about the player base health based on his 200,000 player IDs, which is what he said the main aim was are likely still pretty sound (but not his analysis on BR brackets and match lengths by specific mode, those are broken too for another reason; see below), even if the relative mode popularity numbers he came up with here are not reliable.
But what else could we draw from the data set, given that he’s been so nice to share it? Oh, there’s some fun stuff in there, which we’ll get into here next, in a followon post.




