How many people play the different nations in War Thunder? What are the most popular modes? What are the best modes to avoid uptiers and maximize downtiers?
Every War Thunder player I think has wondered this at times, and there’s been constant attempts to guess at the answers. People look at the match queues, some have tried to scrape replays, opt-in sites have been set up to try and crowdsource the answers, for at least a decade of War Thunder’s existence. Gaijin as a company didn’t offer much help, and it was generally assumed this was to avoid proprietary data issues or let players having the data min/max more. So the guesses continued.
In 2025, that appears to have now changed, with the arrival of Statshark. I can’t say I know much about the owners, but their access to player data is simply on a next level compared to anything that came before. No opt-in is required, and the data on individual players is complete and accurate (as near as I can tell), and made freely accessible to all on the web. I thought at first they might have TOO much access and that this couldn’t last, but they’ve been going for three months now and Gaijin has made no moves to shut them out that I can see. Exactly HOW they’re accessing the data they appear to have is an open question (feel free to comment below if you know anything about them), but the impact on understanding this game at a fundamental level without guesswork is only growing daily as people find out about them.
Statshark has not only competely superseded the opt-in Thunderskill site for player and vehicle stats, which always had issues (see my Data Analysis #2). It’s also proved or disproved all kinds of well-intended guesses and assumptions (including my own Data Analysis #1 article, guessing at average player scores and positional rankings… as it turns out we now know from Statshark player performance distribution isn’t belled, apparently (it’s actually more of a dumbbell distribution) which makes a significant difference to any inferences I drew. Anyway Statshark tells you exactly where you are in rankings in each mode and how much score you’re making, so it’s not like you needed my inferential approach anymore anyway).
So I mean, this is great, right? I do wonder about its sustainability, both in terms of the creator team’s ability to keep developing the site as well as the continued penetrating access into their company data Gaijin appears to have no issue with them having. Possibly the company is quietly outsourcing their player service record needs here, since everyone hates the new in-game ones, or maybe all this data was always available and they never actually minded people scraping it, after all, it just took this long to figure out how to grab it all. I can’t say. So… let’s have some fun with all this data while it lasts, because there’s three questions here it has seemingly definitely answered for a good long time.
1) Nation balance
So as of this month, Statshark has added a new feature, total battles by mode, BR and nation, with monthly stats going back 3 months. This isn’t total battles per se, this is total players by nation in battles at that BR. Another way you could describe this stat is battle “sessions.”
In total, according to Statshark there were 250,775,930 sessions in the April measurement period, across all major modes. [LATER EDIT: Statshark confirmed after this writing “AprilMay” means the stats for April 1-30, scraped as of May 1, etc]
Ok, so before we go further, it might be worth asking, is this a plausible figure? With a multiplier of x25 sessions per battle, that works out to 10 million battles per month, or 120,000,000 War Thunder battles a year. Seems a lot.
This is also rather more than previous estimates. In 2021, when the player base was about half the size as today, LtChambers, scraping replays, counted 110,000 battles in a week, which would have worked out to 5-6 million battles a year. In January 2024, content creator K2 Krabiwe tried the same thing, and came up with 3,145,140 Ground RB flyouts over 3 days, which would work out to 10 million Ground RB games in a year. Even accounting for growth in the player base, those numbers are both lower than what Statshark says for battles played last month.
However, it’s possible the replay-scraping methods here could have been imperfect. Because we also have Gaijin’s own 2024 stats (War Thunder in 2024 — an infographic - News - War Thunder) which stated there were exactly 122,242,831 battles last year… pretty close to the Statshark figure of ~120 million when annualized. It’s all pretty fuzzy though, we don’t know the precise parameters of the Statshark data set or the War Thunder marketing piece, but it make it at least a plausible number. [LATER EDIT: Statshark has confirmed the average number of sessions per battle in April was almost exactly 28 in their stats, with 9.9 million battles recorded, so I wasn’t far off above.]
Broken out by nationality, the April stats for sessions by mode and nation look like THIS:
Spoiler

The dominance of the “Big Three” seems pretty obvious, with air games played keeping the US in the running for second place. Everyone else is a quarter or less of that total, with China coming close to pulling ahead of UK for the distant 4th position, and Italy and Israel significantly behind. Anyway, that answers that.
2) Mode popularity
Added all together, and compared to the “Feb-Mar” set, before the last major update, to see how much it varies (relative numbers are better here: I wouldn’t read too much into the absolute session numbers, as those are going to be affected by things like the March update, vehicle events, and the like), we get THIS:
Spoiler

Ground, especially Ground RB, is dominant, with Ground RB being 50% of the matches played, in April with about 20% Ground AB, 20% Air RB, and 10% Air AB, with the other modes as rounding errors.
Note this is quite different from the LtChambers datascrape in early 2021. He’d estimated, again, based on replays he captured, that it was more like
35% Ground AB
25% Air AB
25% Air RB
10% Ground RB
5% everything else
This could have been a flaw in that scraping method of course. But if not, it would mean the majority of the significant growth War Thunder has seen since 2021 (the Steam average player count this month is over twice what it was in January 2021) has been in Ground and specifically in Ground RB.
I won’t go into the other modes much, other than to point out one thing about Naval. One thing people have said is that naval AB in particular has dropped off since the significant gameplay changes in the March major update. Statshark apparently tells us how much that drop off has BEEN:
Spoiler

Relative to other modes, or just naval RB, naval AB HAS declined. Certainly it’s accurate to say the number of players hasn’t grown due to these changes, anyway.
[Late update: it’s been noted that the Sim modes, because of the sheer length of their battles/sessions, are probably getting the short end of the stick here, in terms of measuring player participation. Something to consider when looking at their nearly invisible lines on the graphs above.]
3) Up-tiers and downtiers
By counting games by their match BR, Statshark has given the first, plausibly accurate look at how matches are distributed across the range in terms of Battle Rating.
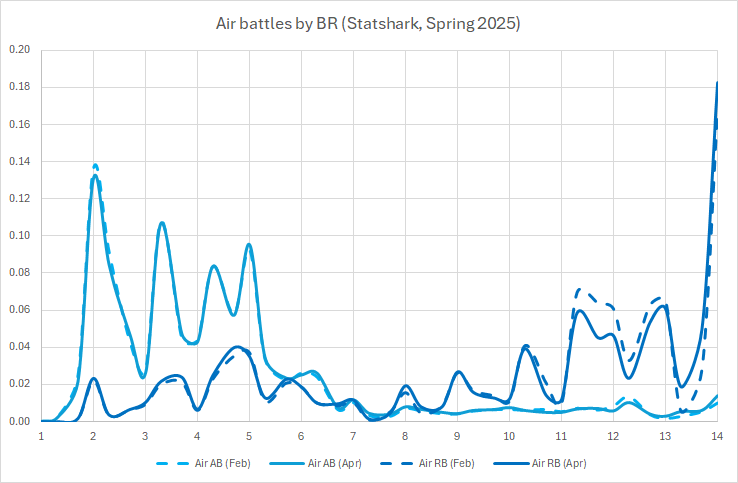
In the case of AIR, we see that Air AB is primarily about the props, with few matches after players get to BR 5 or 6, with Air RB taking up the slack. The up and down wave patterns, with popular BRs cleaning out the 2-3 BRs below them, should be obvious. The difference between pre-update and post-update is very little. What you would see with BR decompression is this accordion wave pattern stretching left-right and narrowing top-bottom.
Spoiler
In the case of GROUND, both AB and RB stay popular as modes through the whole BR range. I’ve collapsed BR 13.0 and BR 12.7 matches together for Ground RB (higher than the ground vehicle BR due to the CAS you bring) as the number of CAS BR 13.0 games is still limited.
Spoiler

In the case of NAVAL, the duelling interference patterns are the clearest… there’s actually a peak-trough impulse coming from both ends in all these. Top-tier, because it can’t be beat, attracts a lot of players. Matching them all cleans out all the 6.0s, 6.3s and 6.7s (I’ve left off the statistically small number of matches with 7.3 as the top BR, due to 7.0 naval players who brought a 7.3 plane in their lineups and bent themselves up a BR step). This leads to a big bow-wave at 5.7, as there’s no BR’s higher to match them with. This peak then puts downward pressure on the next 3 BRs.
Spoiler

However, because you can’t go lower than 1, there’s another wave coming from the other side. 2.0 games suck up all the 2.0s and below, which creates another trough for 2.3-3.0, and a peak at 3.3 (also because that’s the starter bluewater BR for naval ofc). This SHOULD lead to another peak at 4.7, but between 4.7 and 5.7 the two waves "meet and you get an interference pattern between the two effects.
I include SIM here more for the BRs that those games are being played at than anything else, just for general interest. Like naval, sim is basically a rounding error in terms of games played.
Spoiler

So depending on where you are on the wave, your ostensibly 25% chances of getting either a full uptier (BAD) or a full downtier (GOOD) are quite variable. For instance, Here’s a chart that shows, as of April, what your chances were of getting either of those possibilities in a game, depending on mode. Min/maxers, enjoy:

So for instance, in ground RB, at BR 4.7 this month you got a full uptier 3 times in 5… however at 3.7 or 5.3 it was a full downtier over half the time. This distribution is going to be pretty consistent month over month; as the graphs show, an update and BR changes without any decompression doesn’t change it very much… So it’ll likely last at least until this June update, which is promising at least a new BR or two in naval, so that will change the pattern there again. If Statshark is still around, maybe we can return to this again. But I encourage you to visit them and if you think they’re doing valuable work, support them as well.
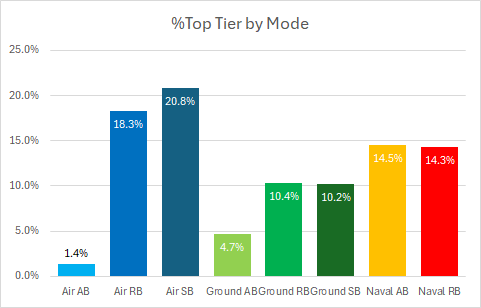
UPDATE: Bonus stat: % of player-matches at top-tier, by mode
UPDATE: Bonus stat #2: match fairness (full downtier - full uptier chance) by mode
UPDATE: Bonus stat #3: How far did the Naval AB playerbase actually go down?
UPDATE: Bonus chart. What exactly happened in naval this spring?
UPDATE: My comment on current allegations against Statshark and Final thoughts on the last month of data and the eight months we had overall