with hightier is meant the range from 9.0-11.0 and there is just a simple rule… stay at distance and guide your bombs from 6km or more and the radar spaa cant do shit.
1 Like
It would be so funny, since IS.7 is from around 1946-47… Same year as the ARL-44…
Also IS-4 from 1944…
Historical MM would kill the game in a day. For an even sure, it could be added, but it would be the same as the WWI event where at certain BRs (or years i guess) a nation would have like 95% win rate.
Good luck with Pz IIs and 38t VS B1 Bis and Matilda too.
It is not…
Because UK and China are comparably smaller and thus are played by better players.

So let’s see what he actually said:
![]()


I wonder why you left that part out from your quote…
let’s see the actual GLOBAL data:
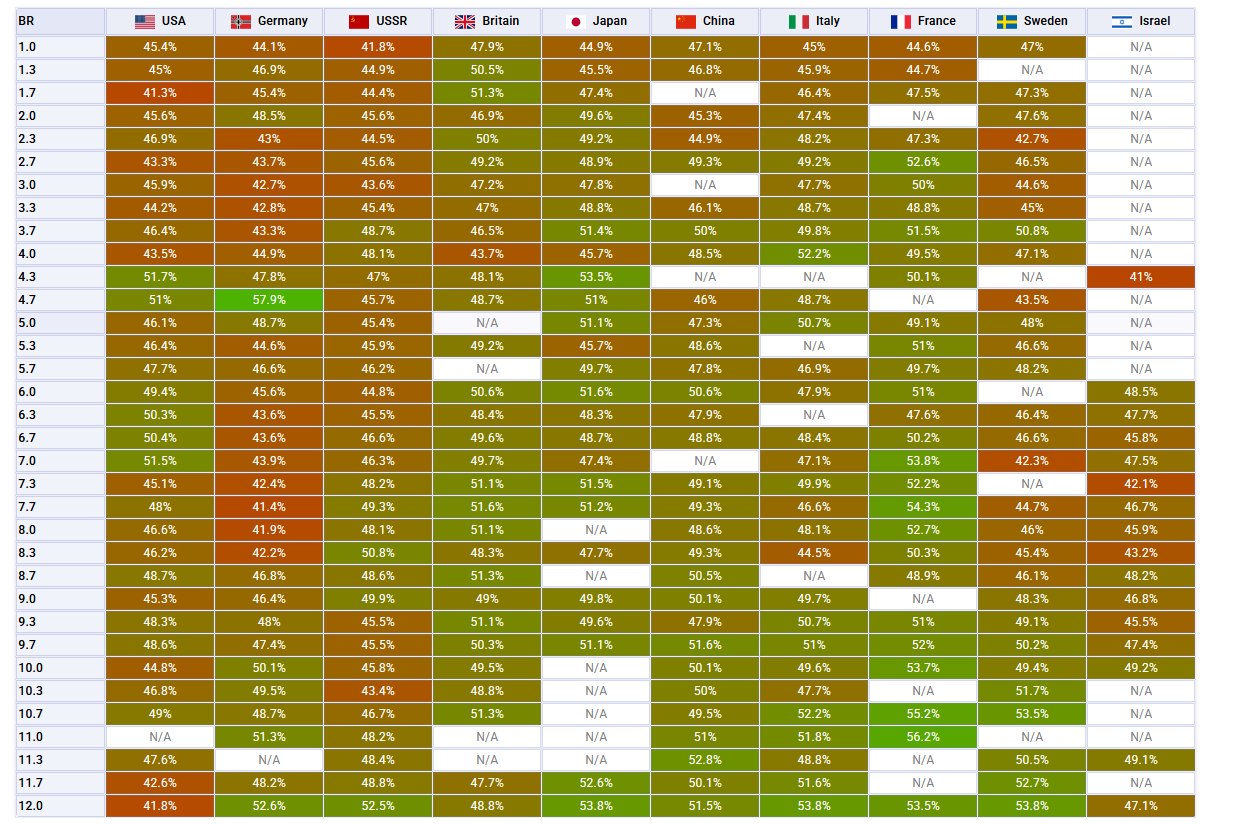
Look at that! Only 0.1% difference!
you dont use all time data if you want to discuss new trends
1 Like
Irrelevant, as my point was to expose the guy being dishonest.


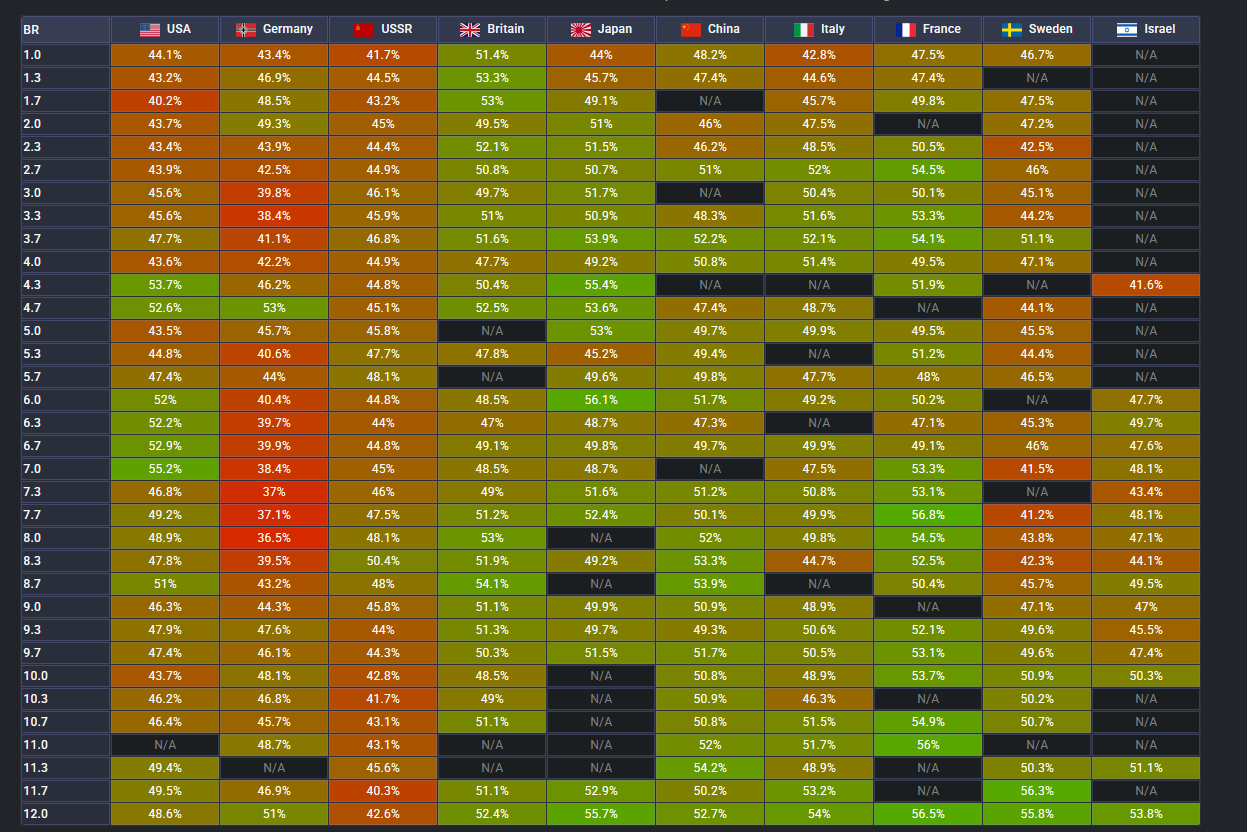
I do not want to see historical matchmaking since the whole point of this is to be as assymetic as possible, but using the newest statistic is not false

While it not being turned on…
Unless Motorola meant last month (which is unlikely, since his argument states that they are “pretty much in line with german one”) the most likely explanation is that he meant all time by global.
I never said it is false. What i mean is that if you think that using all time stats is bad, then you quote the WHOLE thing and explain why that thinking is bad for this current argument, and NOT quote it in a way that is obviously dishonest.
Maybe the quote thing would have been good,
It probably would have been better formulated with: all time data is irrelevant when looking at the actual performance(so its my bad).
2 Likes
I dont think it is always bad, i think there can be (a few) cases where all time data is better.
or for example a time graph, something like this:
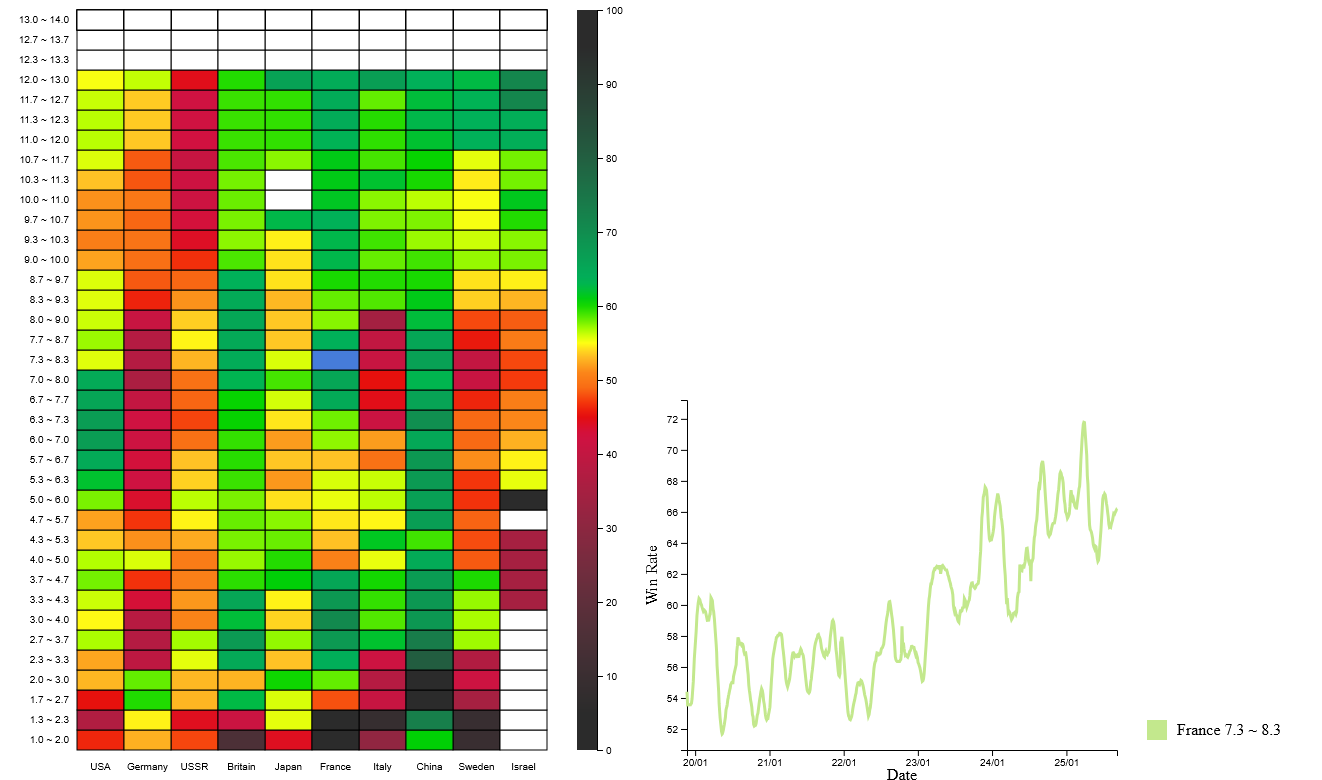
Obviously the hard part of this representation is that you need multiple graphs for each nation and BR, since all on one graph would be unreadable.
True, sometimes you need more than just a month to detect an outlier. Personally I would take the previous months as data to see the pattern since this graphic does require more than one br range bracket to read the winrate of crertain stuff.
1 Like
To be honest arguing for “russian bias” with win rates is one of the dumbest thing. Not like most (if not all) other arguments are much better, but this is exceptionally bad.
it can say something but it doesnt have to since its not the vehicle´s who make the winrates.
1 Like
Yeah it can say “something” but that “something” is so small (if it even exists) that it is essentially “nothing”.
This bias cope was going on since the game was published, yet NOBODY could ever bring any evidence or a logical argument that would prove it, or at least show it’s existance even remotely likely.
All it is about is showing things like bugs, one off scenarios (while ignoring all the others when it happens to non russian vehciles) or just straight up not understanding mechanics of the game.
Devs are russian so they have to promote russian propaganda reeeeeee.
Admit that they are just bad at the game? No, they got killed because of russian bias! Oh what you say? He got killed by a japanese tank? Still russian bias!
Funniest one I´ve seen was someone complained he cound pen a t-34 with an m18. he uploaded a video calling it bias. This guy had HE loaded in his gun and complained he couldnt kill a t-34 with m18, he even tried to profe it with the penetration anylysis in the hangar.
Dishonest ? I think latest data which is for last month will give better representation of current meta, all-time statistics will give only confusing result’s
There are TONS of players like that. Another one (even funnier/more sad, depending on how you view it) was a guy with 50% APCR, 50% HE in his Tiger E calling it bias when he could not pen the IS-3’s upper plate with HE.
Yes, the way the guy quoted was dishonest.
Him using latest 1 month data IS NOT dishonest. What IS dishonest is quoting only the second part of the original comment in a way that completely distorts it’s meaning.
1 Like
Tbh I’m not sure what is going on with Germany, and it could be the better players are in sub nations.
But in game it really comes down to reload rate. At top tier Russia & Germany have the slowest reloads.
Germany & USA players are known for being the worst in game.
USA has the highest wr of USA, Germany, and Russia.
It’s about reload and maneuverability. Which nation has the best? USA
Yet Russia’s T-80Us all are incorrect in reload speed. They should be 6.0 sec reload speed. If you want to see the document I can send it.
Now, given the game doesn’t model a bunch of reloading factors, the T-80Us should load as quick as 4.5 secs, but that’s unbalanced.
Instead, they should make all nato 5.0 sec ace load times, 5.75 secs, fix the Russian MZ loader
1 Like
I meant global all time stats.
It’s clear the last few months haven’t been the best for RU, as one of their main selling points got neutered.
@O_HOgameplay
Nah I meant all time stats to prove RU isn’t winning more than GER is for example.