Why? The fact that you don’t want to give them freely says a lot about you. Also the fact that you haven’t shown the other CL/CD diagrams from study you copy pasted initial CL/CD diagram from also shows.
You never gave me the chance bro you assumed you knew
So I stayed quite and let you do what you just did
Re do the 14 degrees AOA calculation with 14,500 thrust
And a CL of .89
SHOW THE WORK
Then tell me the result
My guess would be a slight bleed
Show the source. Where are we getting 14,500 thrust from?
I told you provide the answer first
Then I’ll go through my docs and give you the whole section
The only thing you are doing is asking me to basically cut the thrust in half; i.e you think the calculation is for vectored thrust. Or Harrier installation values are truly abysmal dogshit.
Mkay clearly you can’t just play nice
Just do the calculation
Or maybe you did and discovered the outcome was close to my guesstimate
You show me yours and I will show you mine.
Nothing to do with installed thrust this is net thrust the drag created by the intake on the surface of the engine results in less pushing force
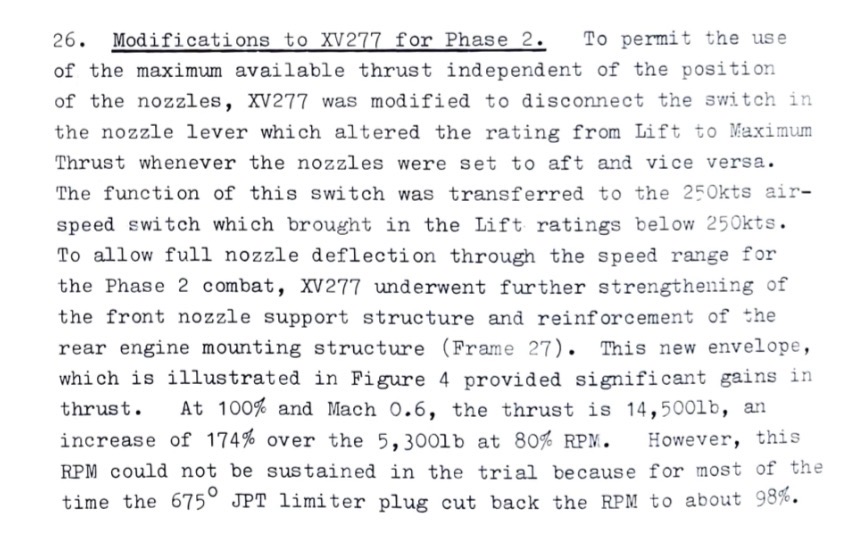
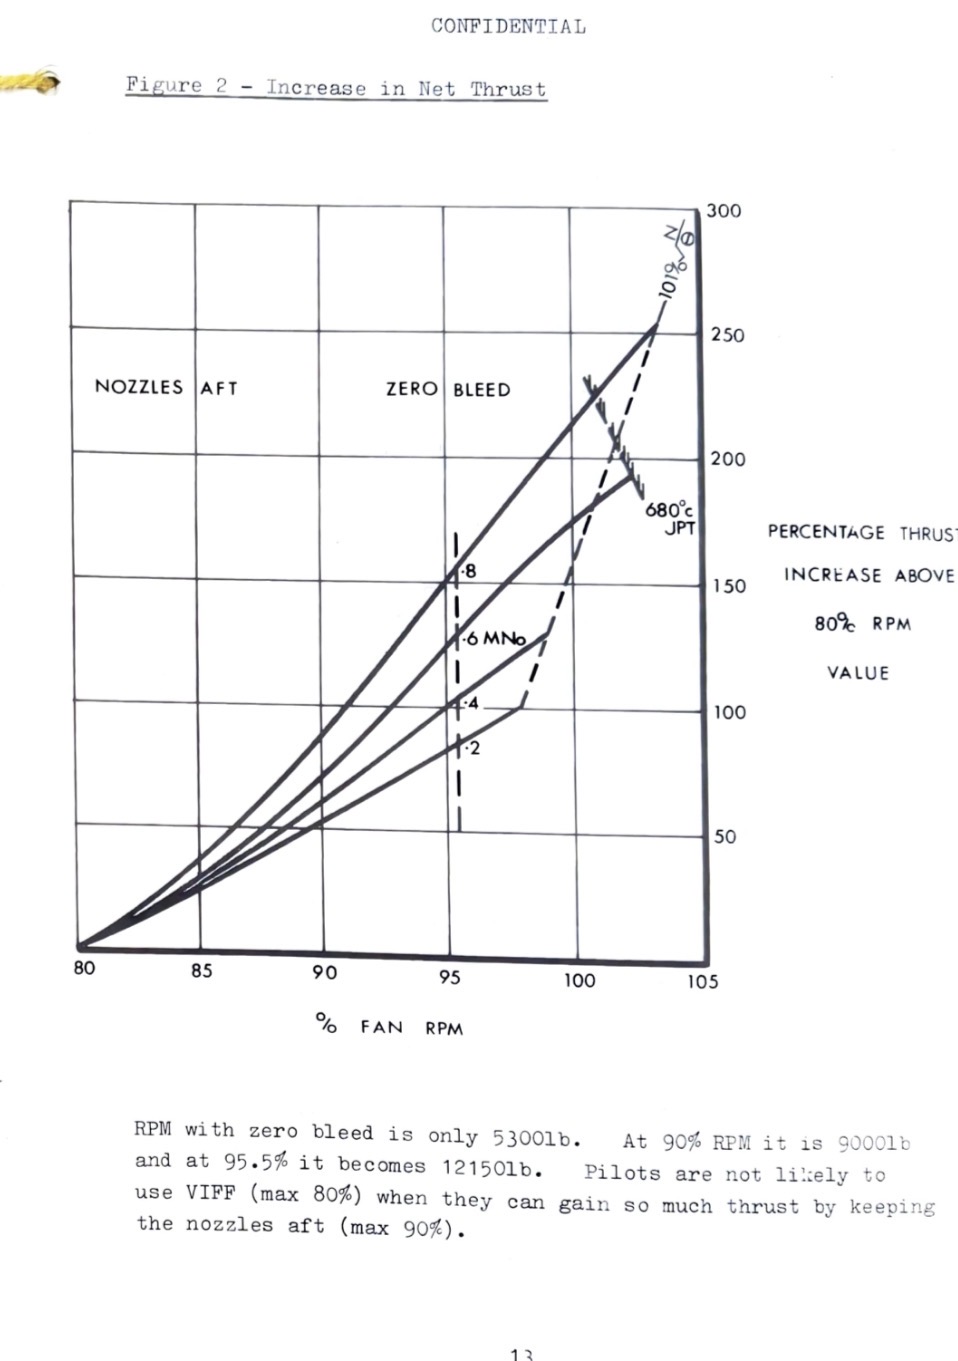
Okay so the Harrier is incapable of making 25,000lb thrust when nozzles are directed aft? Yes or no? Or is it capped at 14,500?
Do you or do you not understand how net thrust works
Show me your result and the work fair is fair
The documents you posted seem to be talking about increasing the thrust vectoring rpm limit. Doesn’t seem very convincing.
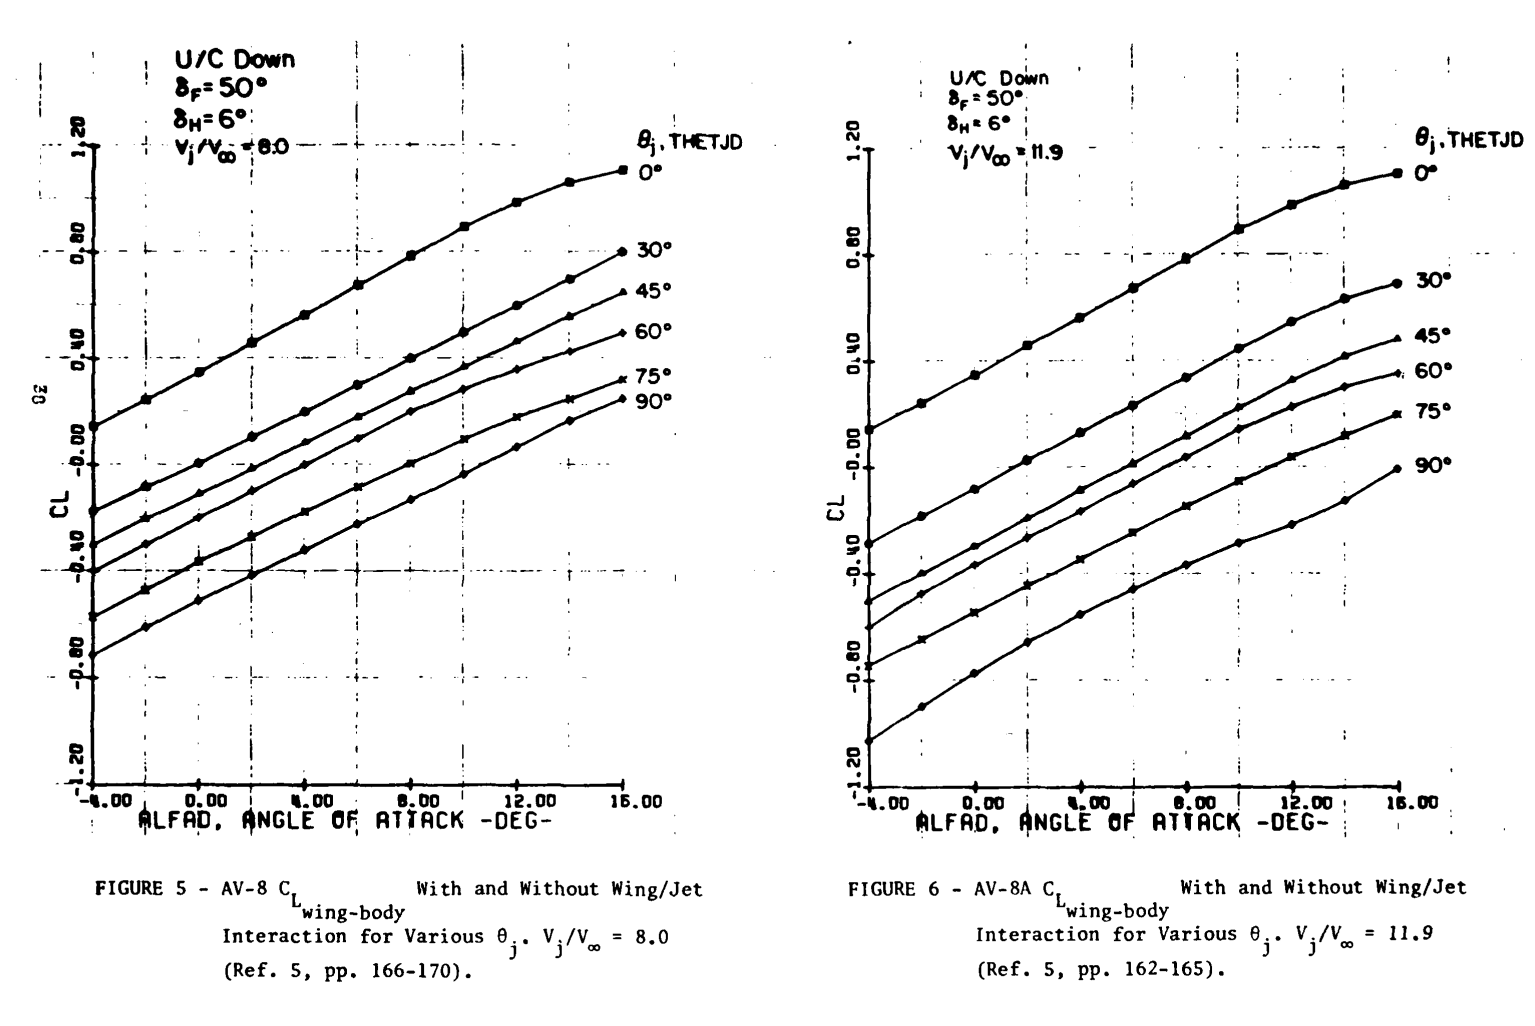
It also appears that vectored thrust decreases CL according to source you got CL diagram from.
Lmao show me your result
We are talking about wing Bourne standard flight performance
(The CL is lowered at a given AOA simply because the wing thinks it’s at a lower AOA then the rest of the plane)
Give the result and stop stalling
Show work

Technically it works. Although pretty sure if I do this with any plane engine it would skew the equation anyways. If you do same assumption on F-16 CL/CD diagram and use approximate net thrust value then plane on paper can’t do 10 degrees per second.
No son thank you
This represents a harrier 1 pulling about 6G at 400 knots with the engine running at 100% rpm
The data is based on all the docs I’ve used originally to come up with my hypothesis
Essentially what you have just done, and I’ll spell it out for you
Is prove with mathematics that if you input the data I believe to be correct into the maths then the resultant matches the irl E-M chart very closely
Thus proving all my theories on wing lift drag and thrust correct and yours incorrect
If you did 12 degrees AOA with the drag in the trim maps same thrust and a CL of .795 it would likely meet the sustained G
It has not proven anything. It has proven that we can use two different values to get to sort of the same end result; i.e the same sustained turn rate. However using 14,500 as the reference number is also going to thrown subsequent bleed rate calculations off and likely make them worse.
Not really as you use almost half the AOA to get to the same G
Much less drag a little less thrust = lower bleed
Not to mention the harriers intake and engine recover thrust at higher Mach numbers resulting in higher net thrust