This is also incorrect - the forward and downward thrust components are equal at 45 degrees nozzle angle providing overall more thrust then the engine makes static. And at 60 degrees it’s makes its peak thrust components
Good job on feet pics math
Math you didn’t even need to do as a diagram and thrust components data point was already provided.
The 28,000 and 14,000 figures hold up at 45 degrees nozzle angle not 60.
Even still the relatively low bleed rate is contributed also in part by the increased aerodynamic efficiency.
Don’t even say something about no full documentation.
Ive given you the full reference you can go and read the full thing.
Likely not true when compared to a CTVC harrier.
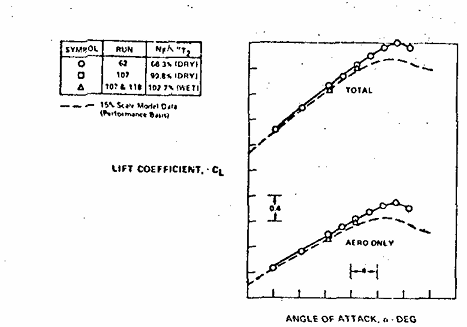
Given that the Cl of the harrier at heavy buffet is around .9 using only the wings standard aerodynamic lift coefficient.
As seen below there is a massive uptake of the lift coefficient here it appears to be close to an increase of 2.4.
Simply the added coefficient of lift proved by the change in airflow over the wing greatly exceeds the overall maximum lift coefficient achievable by the F-18
Buddy…look at your chart really closely.
The thrust at 0 degrees / no vectoring is 20,000lb.
The thrust at 60 degrees is 10,000lb.
10,000lb is half of 20,000lb.
Holy moly it’s a basic trigonometric problem. Wow. Amazing. Yet you somehow do not understand that.
Ohhh boy another unlabeled diagram from yet another different source and a conclusion based on conjecture. Note that no drag diagram is included… curious.
The simple explanation is that you have misinterpreted the document that describes the most efficient way to enter a turn.
I.E they are not slamming the nozzles to 60 degrees deflection and aren’t doing a pure-maximum ITR to enter a dogfight. This would also be consistent with other documents and practices described by pilots. For instance 20 degree deflection retains majority of forward thrust.
The chart shows a CL of 1.5 for aerodynamic lift. Not the 0.9 you are claiming that it is.
Keep in mind I do have the NASA document that Gaijin has based the FM on as well. It’s not worth my effort since it should be blatantly apparent to anyone that you’re just going to keep moving goalposts to try to conjure and argument.
One day we can’t use the EM diagram for the Harrier II to generalize turn performance of Harrier I because it’s incomparable / worse / makes the plane look bad.
However we can use the CL diagram for Harrier II to try to approximate data for Harrier I on the next day because reasons.
Like dude just literally compare sea level diagram of Harrier II with diagrams for anything else at this point and you’ll see the plane is thoroughly mediocre.
No but it’s foolish to try compare it to the harrier 2 chart like you have been trying to do endlessly.
It’s extremely silly. The Harrier 1 chart shows the harrier 1 can sustain a full 6G at .8 Mach
The harrier 2 in that chart can’t even achieve .8 Mach in level flight.
Now you keep talking about the harrier 2 as being mediocre without taking 1 possible consideration into mind - what happens if a harrier 2 is using the normal lift thrust rating? What does the turn rate increase by then.
Seeing as the sustains G value on the harrier 1 was increased by over 1 in some cases. What’s to say seeing as they share the same engine and layout that the harrier 2 doesn’t achieve the same.
At 350 knots for example the Harrier 1 goes from sustaining 3.5G to sustaining 4.5G
What if the harrier 2 increased proportionally like the harrier 1?
3.8 to 4.8 at 350 knots if the added sustained G is the same as the harrier 1
So the harrier 2 goes from being mediocre to sustaining within 1 D/S with a clean F-16. Keep in minds that’s with all pylons and a gun pack. Vs the F-16 being clean, but only for this 1 given speed.
Regardless: We do not have any data to confirm the performance metrics of the Harrier 2 regarding normal lift thrust or CTVC