This chart is complete nonsense. since it is impossible to keep 300m/s at 5G
Sukhoi Su-27/30/33/35/37 Flanker series & Su-34 Fullback - History, Design, Performance & Dissection
How do you know that turn was “sustained” turn rate?
it’s not nonsense lol, the chart measures how much you accelerate holding that overload at a determined speed.
Unit of measurement is m/s because it’s SEP, so one needs to convert it to acceleration:
m\,g\,h = \dfrac{1}{2}\,m\,V^2
\dfrac{d}{dt}m\,g\,h = m\,g\,\dot h = m\,g\,SEP(V) and \dfrac{d}{dt} \dfrac{1}{2}\,m\,V^2 = m\,V\,\dot V
m\,g\,SEP(V) = m\,V\,\dot V
\dfrac{dV}{dt} = \dfrac{g}{V}\, SEP(V)
\displaystyle\int_{v_0}^{v_f} \dfrac{V}{SEP(V)}\;\mathrm{d}v = \displaystyle\int_{t_0}^{t_f} g\,\mathrm{d}t .
If we take the MiG-29, then for it nx = 0.7 at a speed of 850 km/h or 236 m /s for 5G
Vy=0.7*236=162 m/s
It depends on the aircraft fuel load and altitude. MiG-29 chart is at 2000m, here is 200m. Flanker at 3000m and 850kph is about 120m/s while at 200m (which we can approximate at 0m) is ~200m/s.
If things scaled about linearly flanker at 2000m is about 140m/s. It makes sense that is lower than MiG-29 because MiG-29 has better rate at high speed and the MiG-29 is also relatively lighter in the chary where Nx= 0.7 for 5G
This one;
https://community.gaijin.net/issues/p/warthunder/i/pMIS9A3vdNzU
Noted.
Basic dimensional data for the wings, thrust, oswald coefficient, and drag polar are all obviously wrong in the files but to “prove” all of this is difficult. What we can show is that it takes too long to accelerate from 500 to 700 as you said, we can also show it fails to meet low speed non-afterburning turn rates both in documentation and on video.
It likely wasn’t, but he entered visibly slow and left visibly slow - both in full control of the aircraft and without departure qualities. In fact, he had sufficient energy without burner to immediately pitch up and climb out of the maneuver. You cannot do any of this in-game without being on the verge of departure. There is no correlation to the performances of the two.
@Giovanex05 So you need someone to conduct these tests? I can give it a go later. I still think it is worth using the fact that it cannot complete a turn in ~15s even on the absolute minimum allowable fuel load in test flight. (35 seconds)
15 seconds is simply not possible with current Flanker FM even when running on fuel fumes, even with afterburner.
But I think we can give this test a try.
Yes, without a stick it’s impossible to sustain 5G accurately enough while speed is increasing.
Perfect accuracy is also not needed, because any swing in pull (provided average is still around 5) will result in worse average acceleration, which isn’t an issue because to prove our point the flanker would need to be overperforming
Okay, I’ll test today and post here the results
The schedule is still incorrect. Even at 5000m
2x R-27R + 2x R-73 = 716kg
18,900 kg total weight - 716 ordnance = 18,184 airframe
18s with test, 18,184kg + ordnance
Accelerate from 500 km/h to 750 km/h whilst pulling a flat 5G turn as close to sea level as possible.
Even if you think it is incorrect, Gaijin will not take anything else without proof. To fix the FM is to make it work according to the charts available to us at this time.
What kind of radar did the Su-34 have? I got into an argument with someone on discord and they were talkin about it having a PESA, and everywhere I’ve looked has said PESA-
Su-32 has pesa Sh-141 radar.
Quick Google search seems to suggest that it is indeed equipped with V004 PESA radar.
Are you using fully manual? Or with dampening? Looks like theres a funny thing in that - according to some messages it retents energy worser on dampening
Can you test it again?
Testing it with or without dampening does nothing to modify the flight model, it only clamps control responses via instructor. In the past I tested sustained and instant turn rate with dampening and without - the only change is the greater ability to pull AoA without, and a slightly higher responsiveness.
Thank you very much for the test:
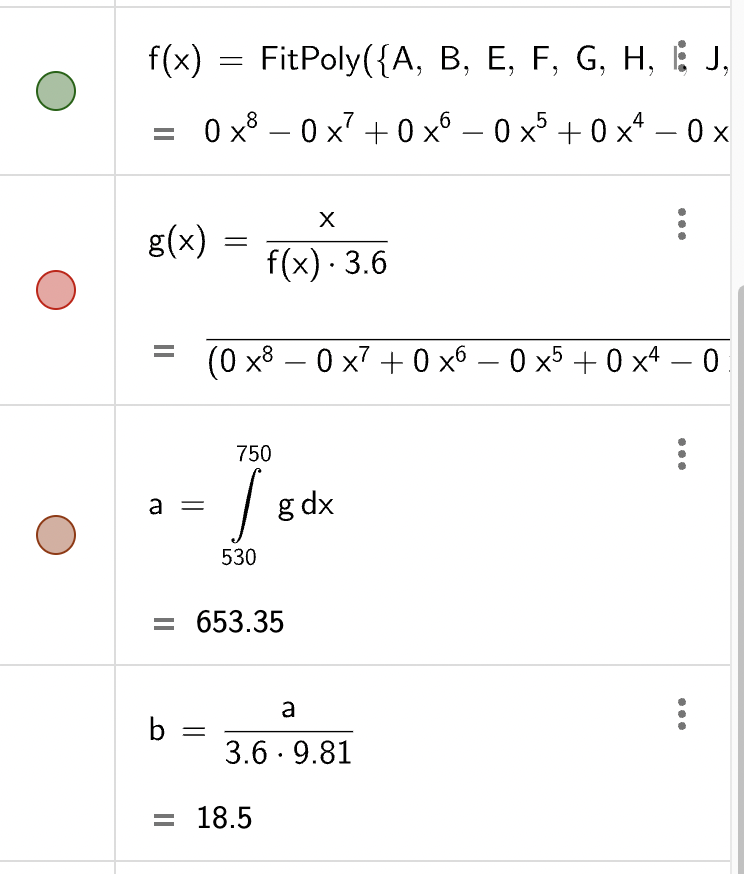
Since the chart didn’t quite cover 500kph and also interpolation isn’t perfect I took the time from 530 kph to 750 kph… theoretical time is 18.5 seconds, test time ~13.5 seconds… need to look it further when it’s less late but looks like we have a case…
Flagged for spam
I don’t see where you are getting the time to accelerate from the chart, is it more or less just the excess power /s added until it reaches the desired speed for datapoint?
Specific excess power is a fancy term (and way) to simply measure how much energy is gained in every infinitively small interval of time, in mathematical terms Specific excess power is the derivative of energy over time . The reasons it’s measured in m/s (or ft/s for freedom units) are:
It’s called Specific because the energy gain is divided by gravitational constant and aircraft mass (kinda like Ny is just normal force divided by mass and grav. constant).
All energy is assumed to be potential (energy is still energy and a part of the one indicated in the sep chart (as in our case since altitude is constant) could be kinetic, but the total amount doesn’t change whatever the composition of kinetic and potential is).
Gravitational potential energy formula: m\,g\,h .
This means that: SEP = \frac{\dfrac{d}{dt}m\,g\,h}{m\,g} = \dot h.
Now in our case all potential energy becomes kinetic, so I equal the two and take the derivative over time of both and equal them:
m\,g\,h = \dfrac{1}{2}\,m\,V^2
\dfrac{d}{dt}m\,g\,h = m\,g\,\dot h = m\,g\,SEP(V) and \dfrac{d}{dt} \dfrac{1}{2}\,m\,V^2 = m\,V\,\dot V
m\,g\,SEP(V) = m\,V\,\dot V
Then i change notation for the derivative of speed (acceleration) from (\dot V ) to \dfrac{dV}{dt} and then solve the diff. equation.
\dfrac{dV}{dt} = \dfrac{g}{V}\, SEP(V)
\displaystyle\int_{v_0}^{v_f} \dfrac{V}{SEP(V)}\;\mathrm{d}v = \displaystyle\int_{t_0}^{t_f} g\,\mathrm{d}t .
\dfrac{ \displaystyle\int_{v_0}^{v_f} \dfrac{V}{SEP(V)}\;\mathrm{d}v }{g} = t_f -t_0
I’ve interopolated SEP(v) from the chart and then let the computer solve the integral for me. (I’ve divided by 3.6 a couple of times because chart x axis is in kph and not in m/s). Then i divided by g to find time interval.
Edit:
The “g” under the integral here is the function g(x) above which is V/SEP(v) (x is speed and f(x) is SEP interpolation) and not “g” gravitational constant.