A little while ago @Bruce_R1 posted some cool analysis from statshark.net. I tried putting together winrates for ground sim teams and also looked at how removing the german KW I C 756 (r) affected the 3_1 lineup. Thought I’d share it here.

I pulled vehicle data from the vehicle cards on statshark.net/globalstats. This data is provided per vehicle, NOT per battle and NOT per player.
One issue with this is that many vehicles are included in multiple lineups. The Tiger H1 is in both the 4_1 and 5_1 lineups. Where do we put the Tiger H1 vehicle stats? I tried dealing with this in two ways.
Another thing is that I only used ground vehicle data. Statshark also has air vehicle stuff but then you have to worry about separating air and ground sim stats. In short, this is all rough estimates at best. Here’s the data I pulled if you want to mess with it yourself https://pastebin.com/raw/YKkiALVv. For fun here’s a table with general stats for May.
Ground sim team winrates
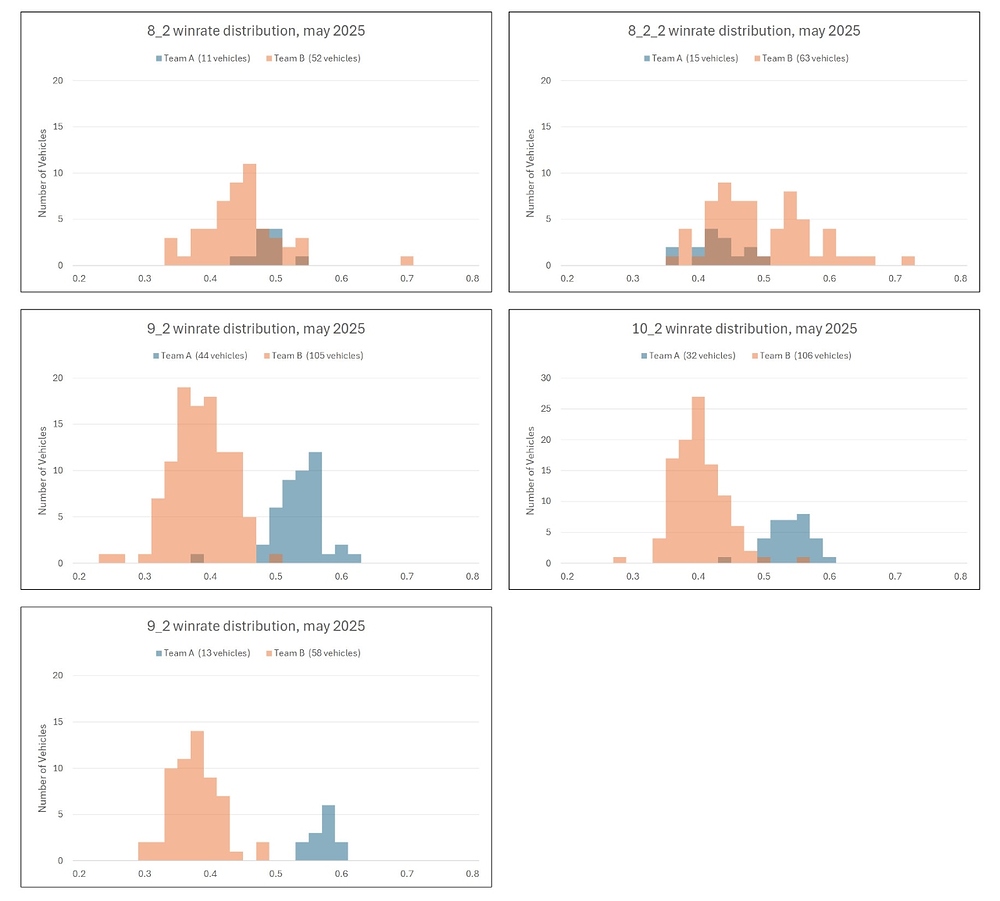
One way to deal with the assigning vehicle stats to lineup problem is to just dump each vehicle’s stats into their lowest possible lineup. So dump Tiger H1’s stats into 4_1. The idea being that players will typically opt to bring the best possible vehicle into a battle. Here’s distributions of team winrates for each lineup. For the lower tier lineups Team A is USA, USSR, etc. For the higher tier lineups Team A is USSR and China.
Another way to estimate winrates is by choosing representative vehicles for each lineup. In the lower tier lineups the big 3 nations USA, USSR, and Germany make up the majority of spawns. For each lineup I chose a representative, high spawn count vehicle for each big 3 nation. So for the 2_1 lineup I chose the representative vehicles Pz. IV F2, T-34 (1941), and M4 sherman. The idea here is that for every 2_1 battle these vehicles will likely be spawned in at least once. So their total victories and games_played are good representatives of stats for their respective teams. Here’s what representative winrates look like for lineups 1_1 to 6_1. Pretty much the same.
Removing the KW I C 756 (r)
Recently Gaijin removed the german KW 756 from the 3_1 lineup. This surprised me since this vehicle was such a popular premium in 3_1. Here’s how it was performing in February compared to other 3_1 vehicles. The bubble scale is games_played with the 6335 games played for the KW 756. There’s definitely some top-right aura going on.
Here’s team winrates from February to May. You can see team winrate trends swap, with multiple team A vehicles climbing to over 60% winrate. The KW 756 went from being spawned in around 6000 times per month to only being spawned in 986 times in May.
I think Gaijin’s pretty responsive to stats like these, so I’d imagine we’ll see some adjustments whenever they next remember that sim exists. I was personally pretty disappointed to see it removed. The KW 756 had the capacity to wreck teams, but I think it was a fun and arguably balanced challenge to face in the old lineup.


