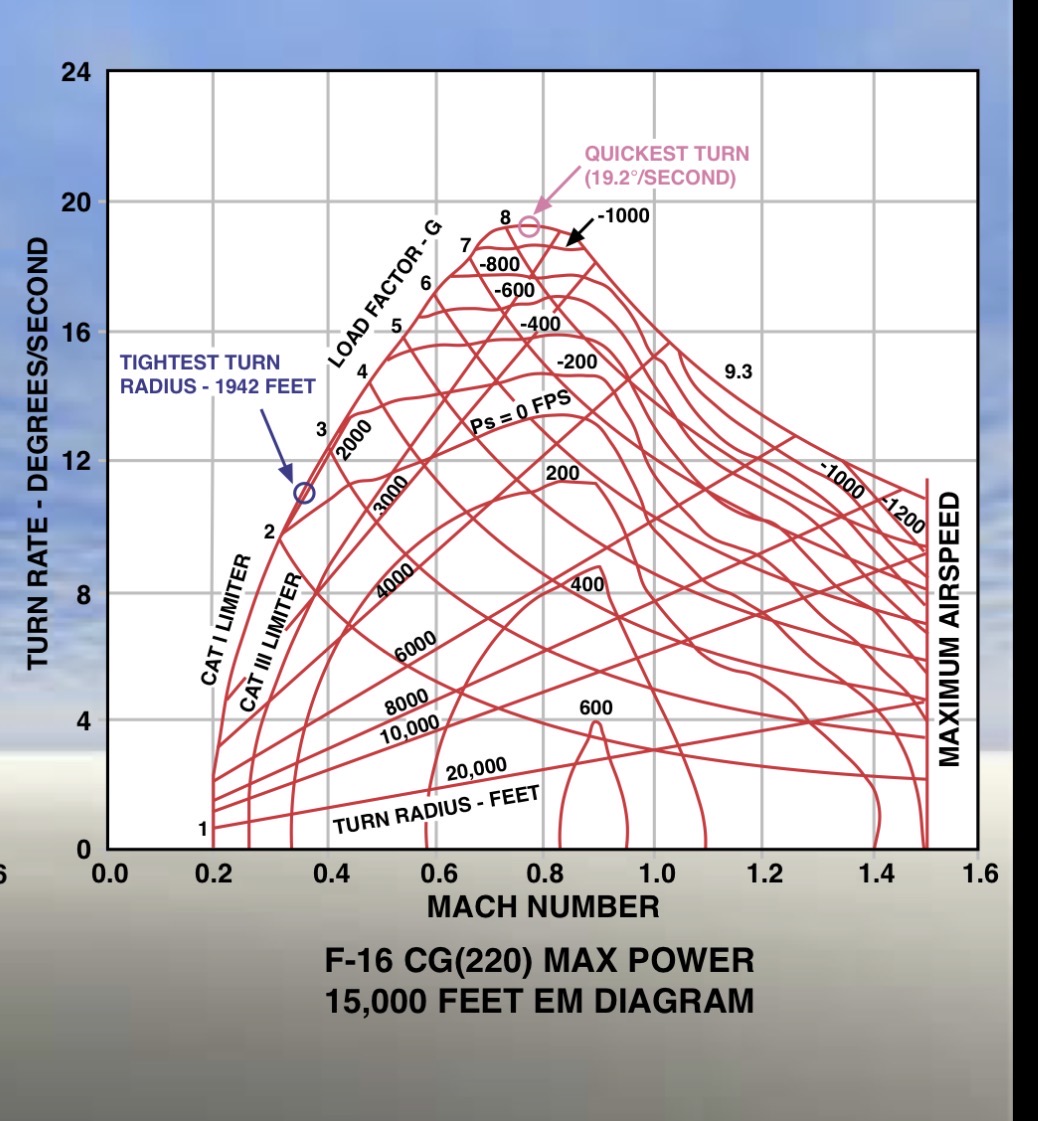
The data is directly from the charts.
The F-16 lift limit is for the F-16A. I am not bothering to go get lift limits for every possible EM diagram variation that I already have.
The data is directly from the charts.
The F-16 lift limit is for the F-16A. I am not bothering to go get lift limits for every possible EM diagram variation that I already have.
That explains it, its from a different weight.
You only compared SEP 0
Well yes…no shit sherlock.
I am comparing them to show that the difference between the NASA chart and the turn rate figure in the GAO report is similar to the STR difference between F-16A and F-16C.
Like everyone else in the thread can somehow follow along with that except for you.
Be civil now squishy fingers.
Now compare the GAO figure with the Heavy F-16 figures
Except the chart doesn’t exist and we have to guess. All that is provided is a number.
Once again I have already done this for you.
This red line is already present in my initial assessment.
Shockingly when you put 85% fuel in an F-16 and give it a pre-FADEC engine…it will turn worse. However 85% fuel F-16 is not a fair comparison against F-18 w/ less than 60% fuel + Missiles.
Not what I asked you to do
I am pretty sure it was after Phase 2. The study for the EM diagram is from 1994.
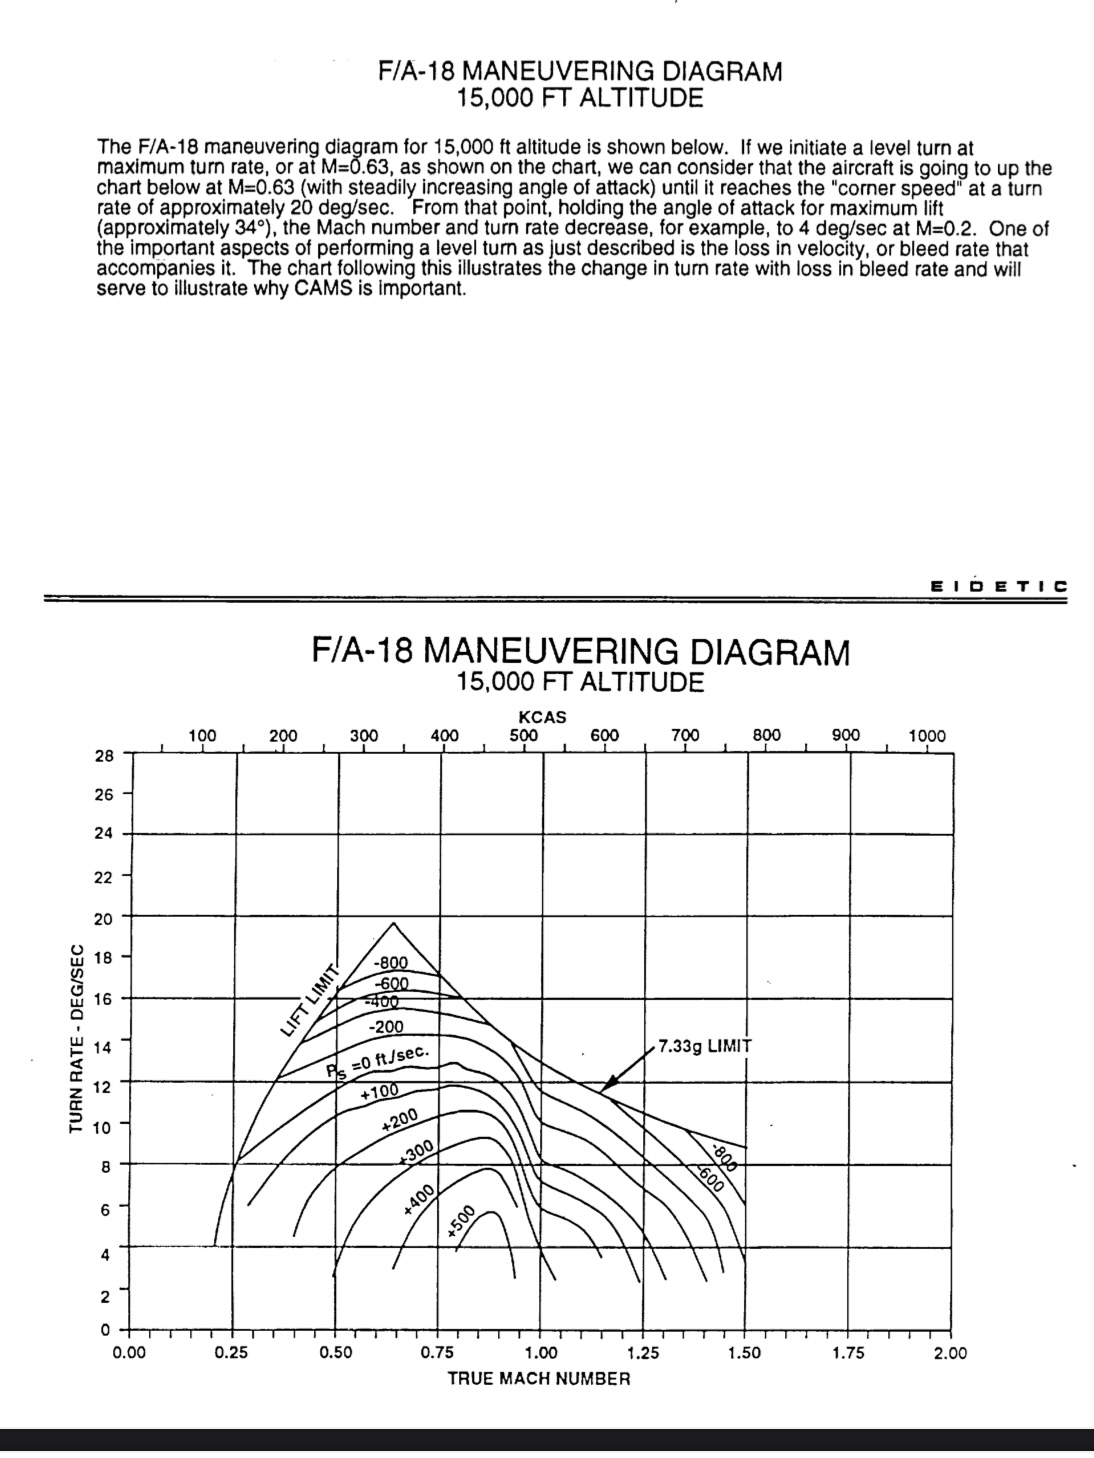
Its figures for the baseline F-18
Again compare what I said to compare
Use the figures from the Navy the 12.3 compared to the F-16 when heavier.
You just need to scroll up to the initial post. The NASA F-18 lines are in the diagram as well as the heavy F-16 line. It can be assumed that a heavy F-18 would perform worse than the NASA reference F-18.
then the chart is completly irrelevant
even disregarding the missing weight figure
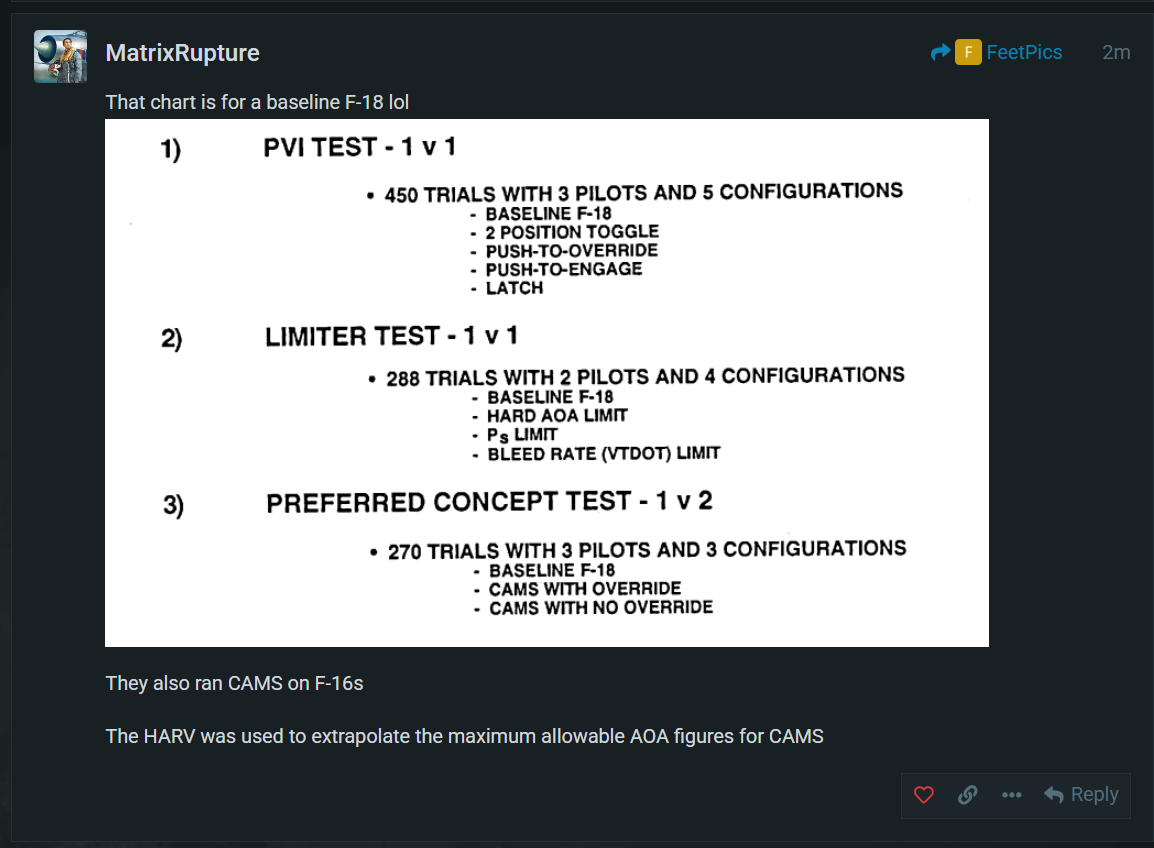
That chart is for a baseline F-18 lol
They also ran CAMS on F-16s
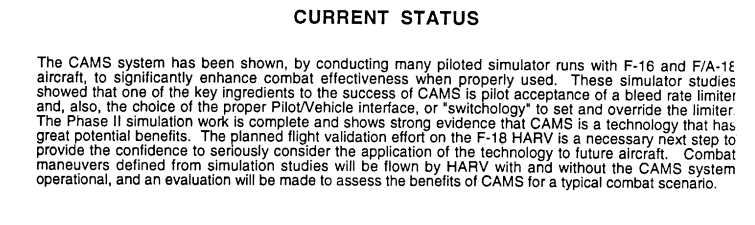
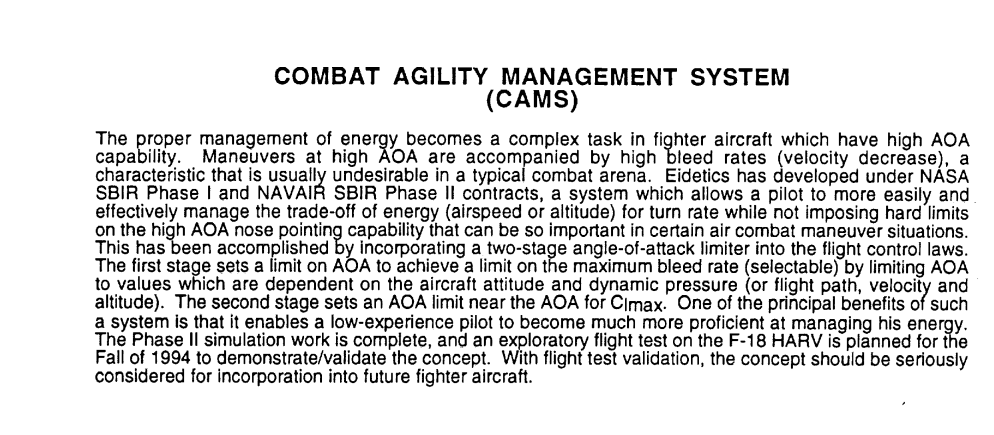
The HARV was used to extrapolate the maximum allowable AOA figures for CAMS
Still never compared what I said to compare
If we are going to be pedantic ill do my own.
We wont use this chart as it is, we will on average lower the value by .7 to match the navy.
Even still below about .6 Mach the F-18 creeps out some advantages.
Its crazy, actual pilots who flew these types say the same thing.
F-16 needs to stay fast and use its superior SEP while the F-18 needs to try and bring it slow.
Yet you are here trying to say the F-16 should be superior over the entire speed range.
Yeah man I think we are done. You are just lying at this point. Or you are illiterate. Or both.
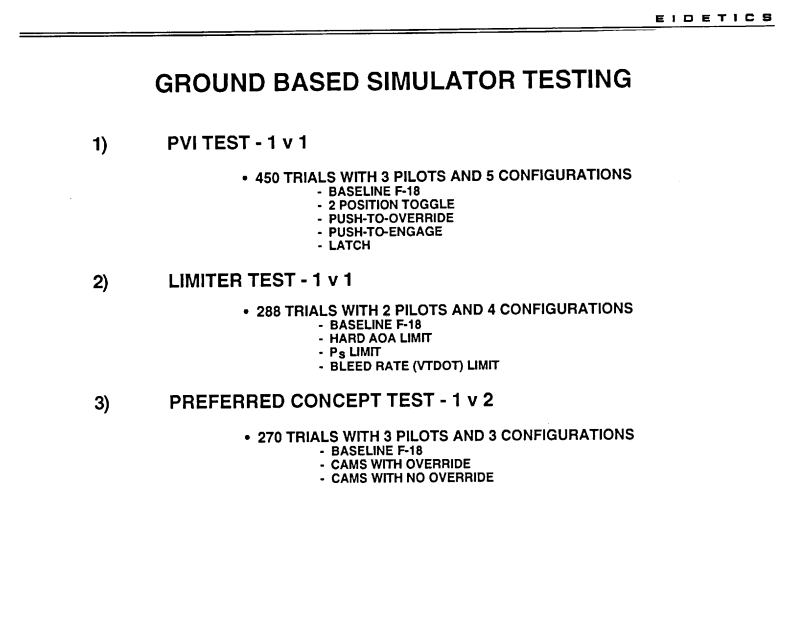
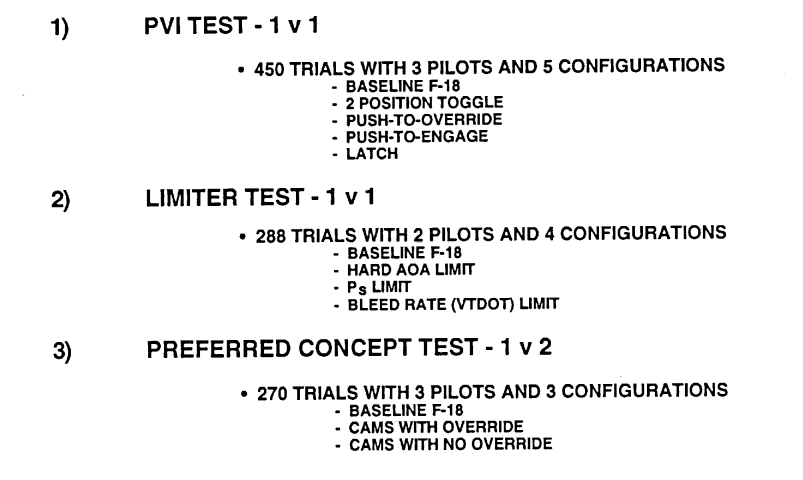
Note that he cropped out “Ground Based Simulator Testing” and also just completely ignored the very next page in the study.
You proved nothing with this really so we can be done here if you like.
The Pilots of these types seem to agree with what i’ve been trying to tell you.
If you read the document you’d have read that the HARV flight tests where planned for after this report was even created.
Meaning the data cant be from the HARV as they hadn’t even flown the CAMS test flight profile yet.
I have never said the data was from the HARV.
Yet you said that they equipped F-16s and F-18s with this software/hardware combo.
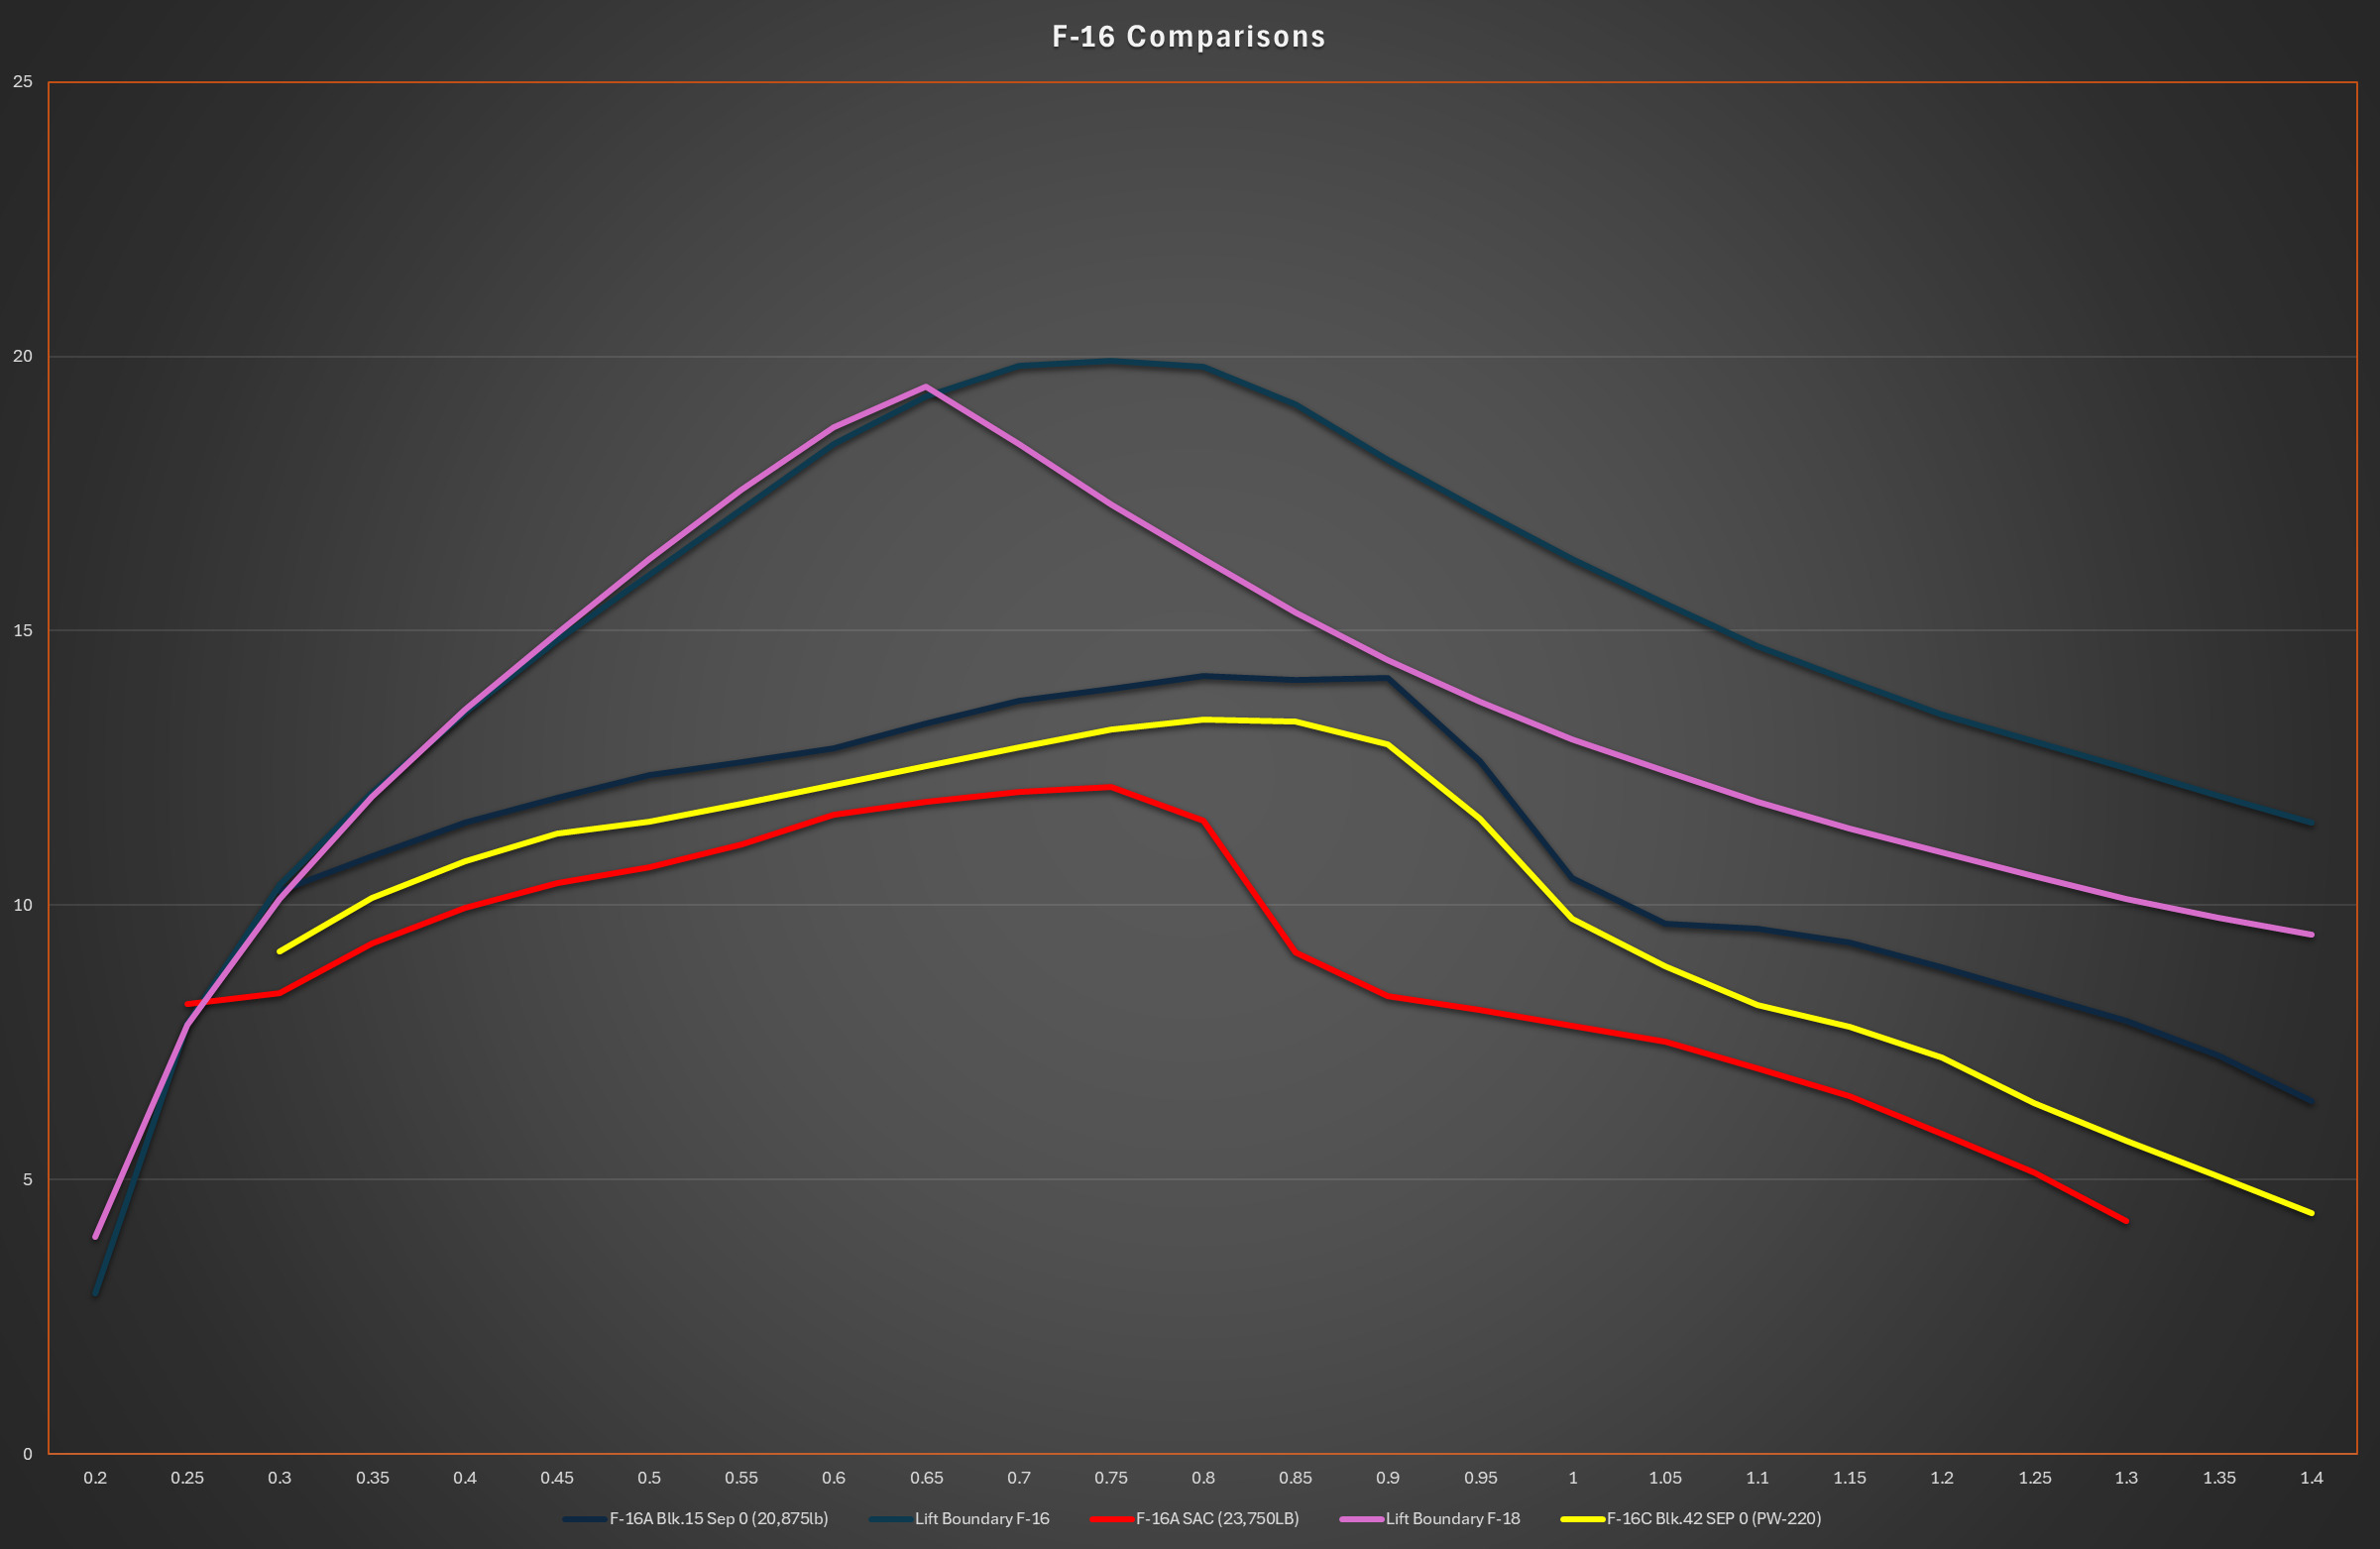
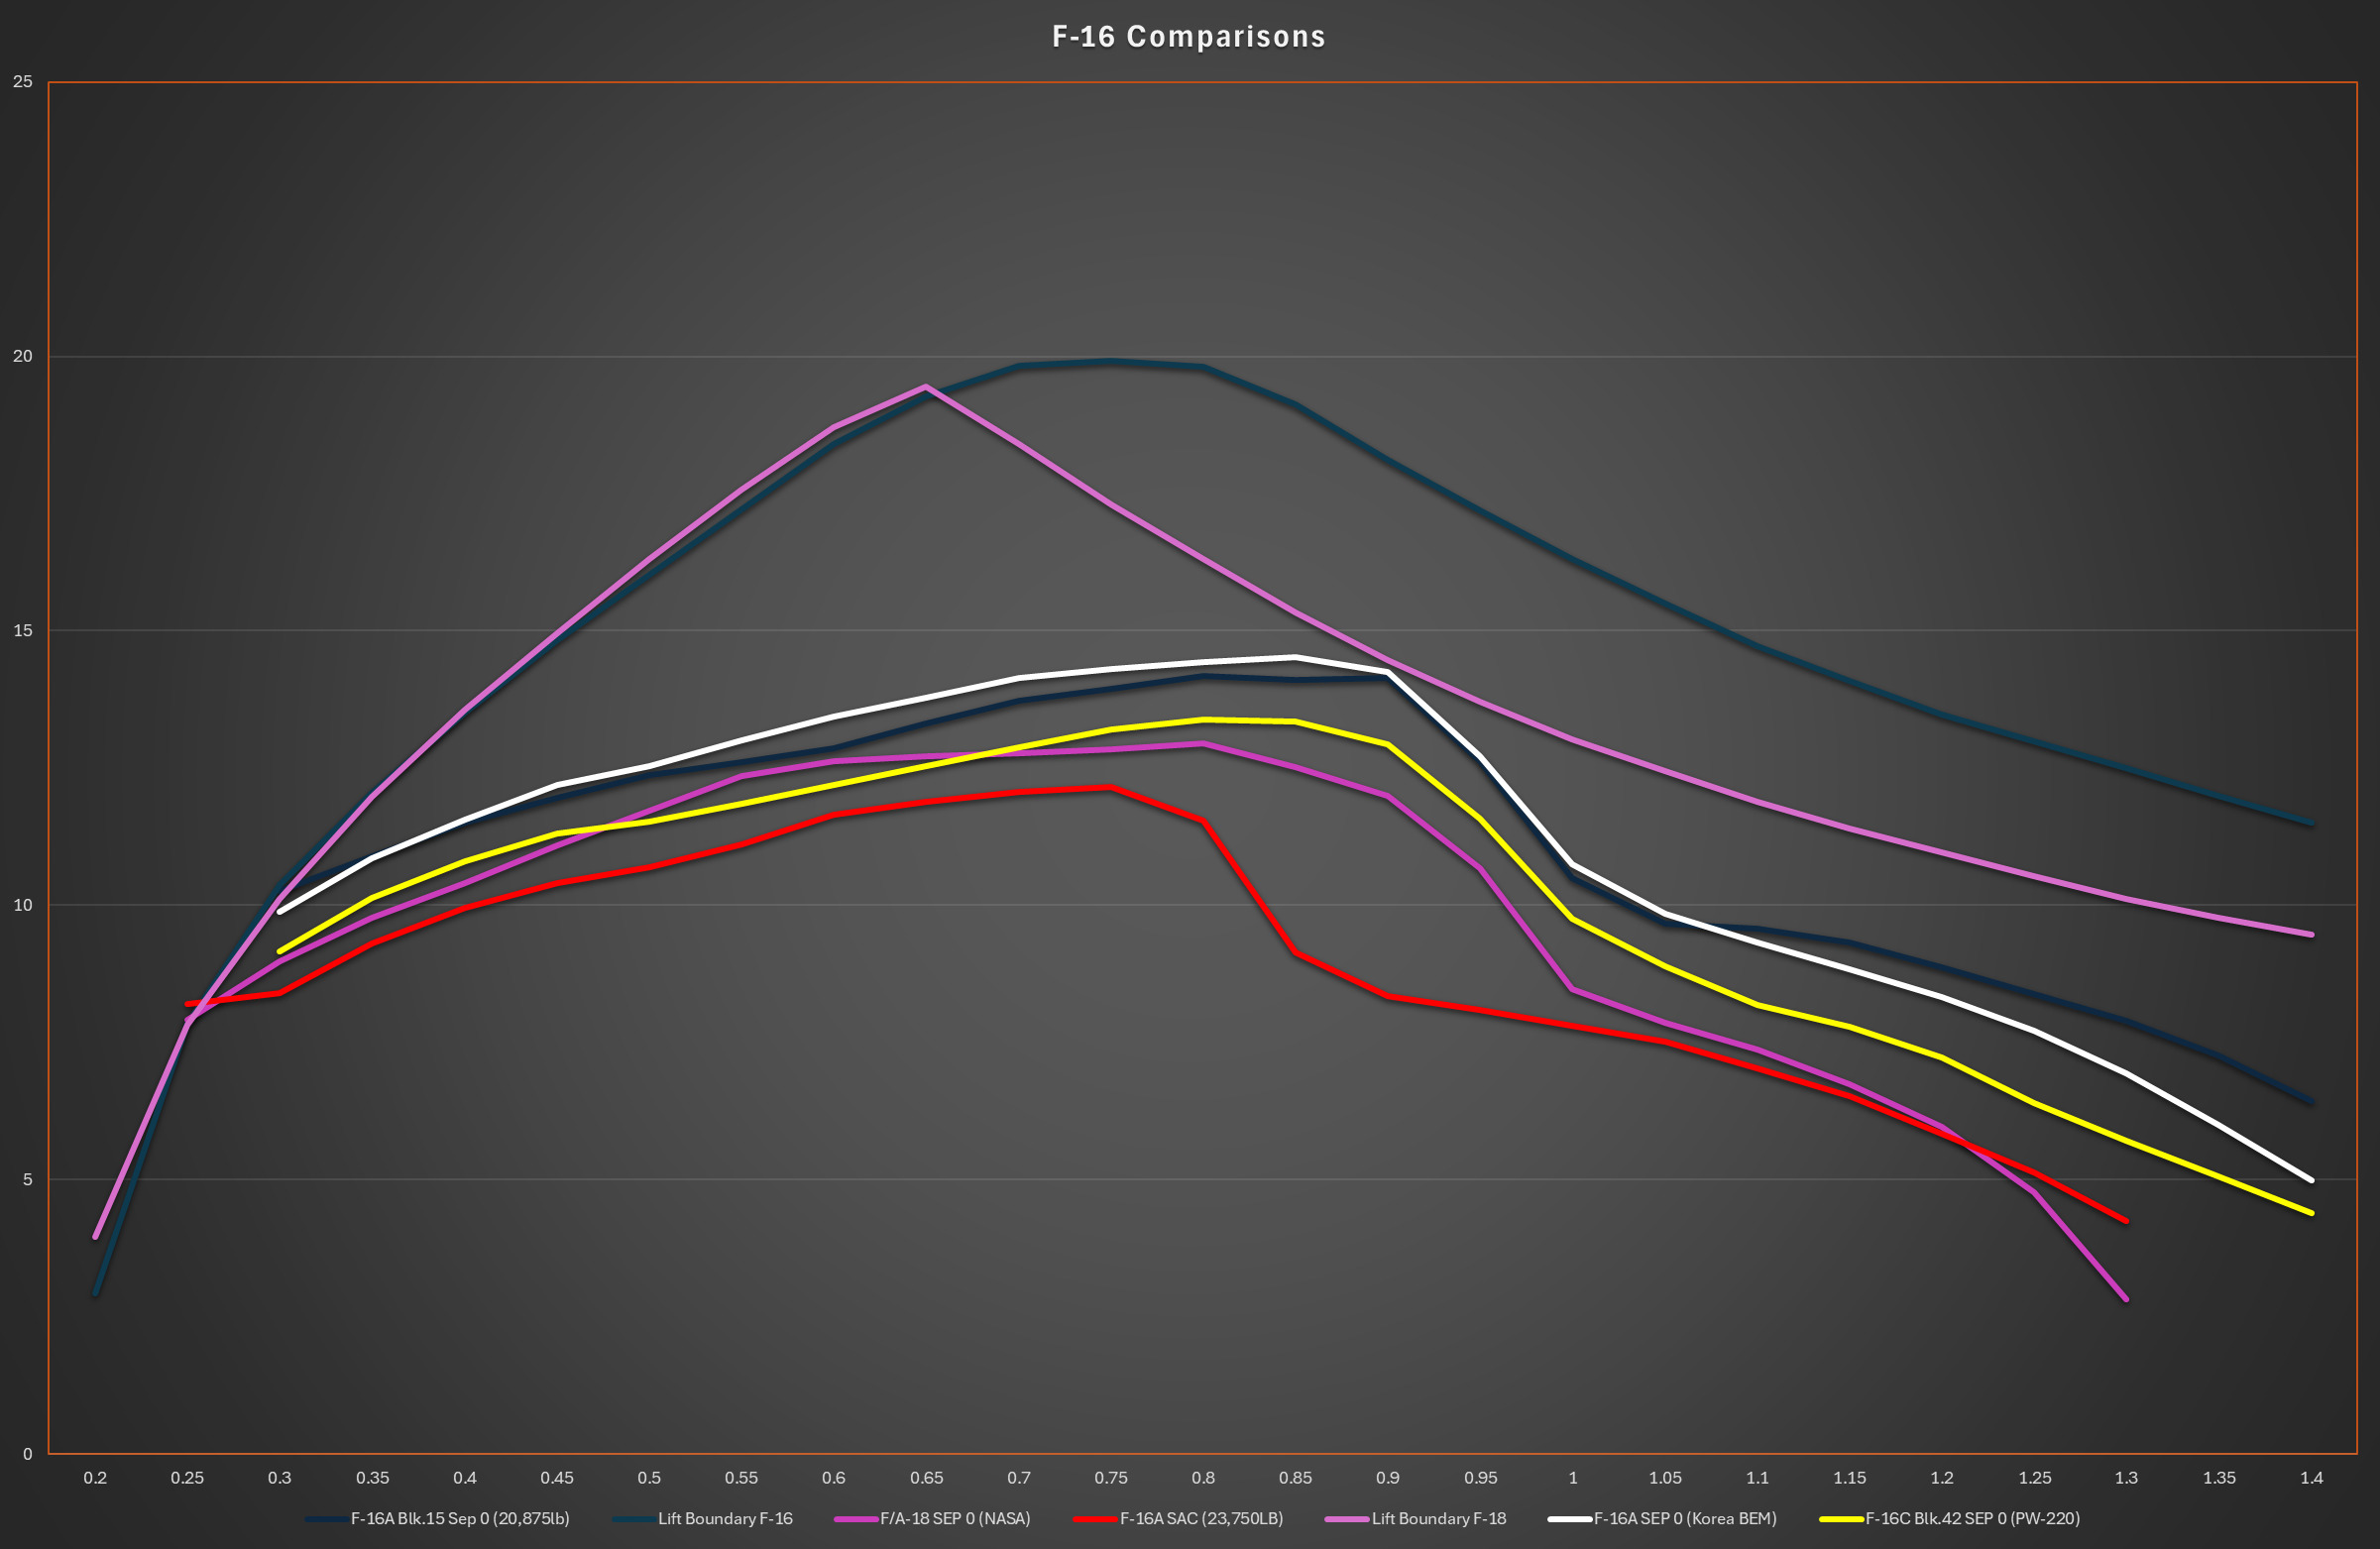
The magenta line is the F-18 performance in the NASA doc. The yellow line is for Korean F-16C. Block 50/52 F-16s have higher thrust so the comparison becomes even worse for the F/A-18.
Do they not also have a higher average combat weight as well.
As for what I said Yellow line vs Magenta, lower speeds has the advantage for the F-18. The lines below .45 Mach would be fairly closer but you’re limited to easily plotted data points.
.45 Mach - .65 Mach the F-18 has some advantage .45 and below as said early they would be comparable.
.65 and up is F-16 territory.
All of the F-16C’s use 22,000lbs as their reference weight.
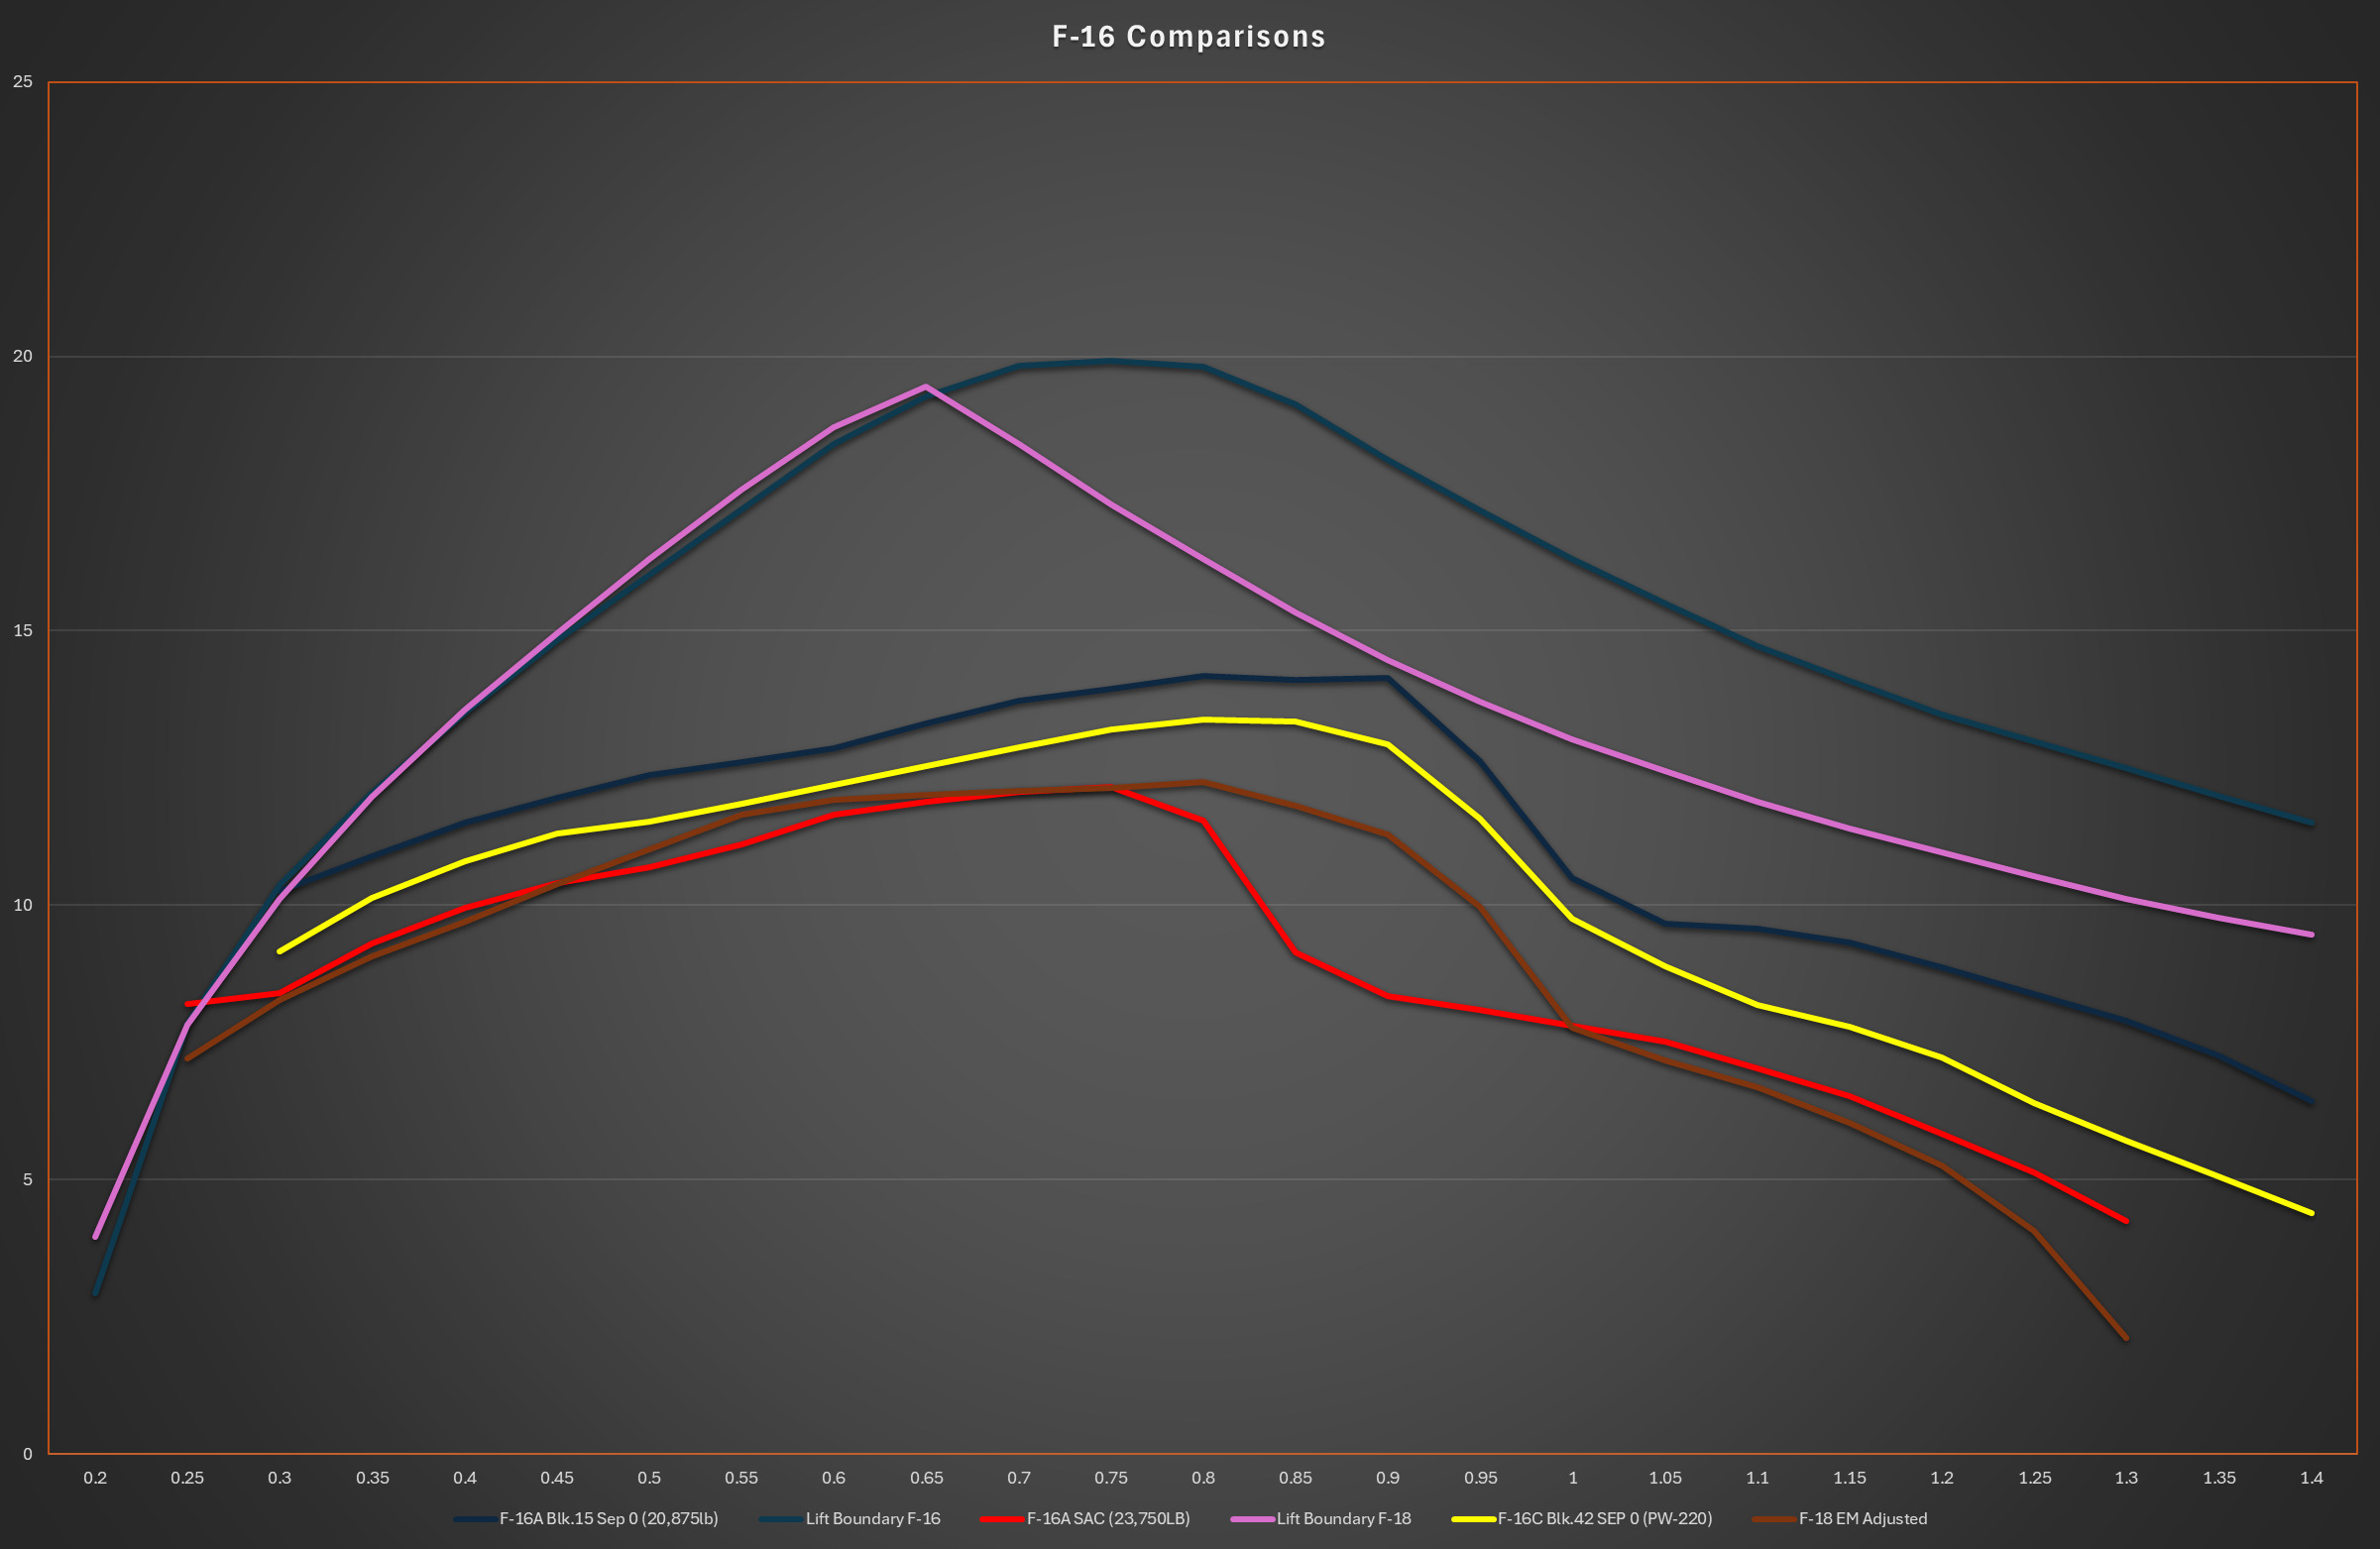
The brown line is the F/A-18 EM SEP values but reduced by 0.7 degrees per second across the board to normalize it with the NASA values that correspond to 60% internal fuel and 4 missiles. As you can see it’s kind of shit.
The only place it has an “advantage” at on paper is in transonic regions. But you can compare the 50% fuel vs 85% fuel values for F-16A and see that this is a region where increased weight has the most dramatic effect and simple subtraction is giving an erroneous value for the F-18 in this region.
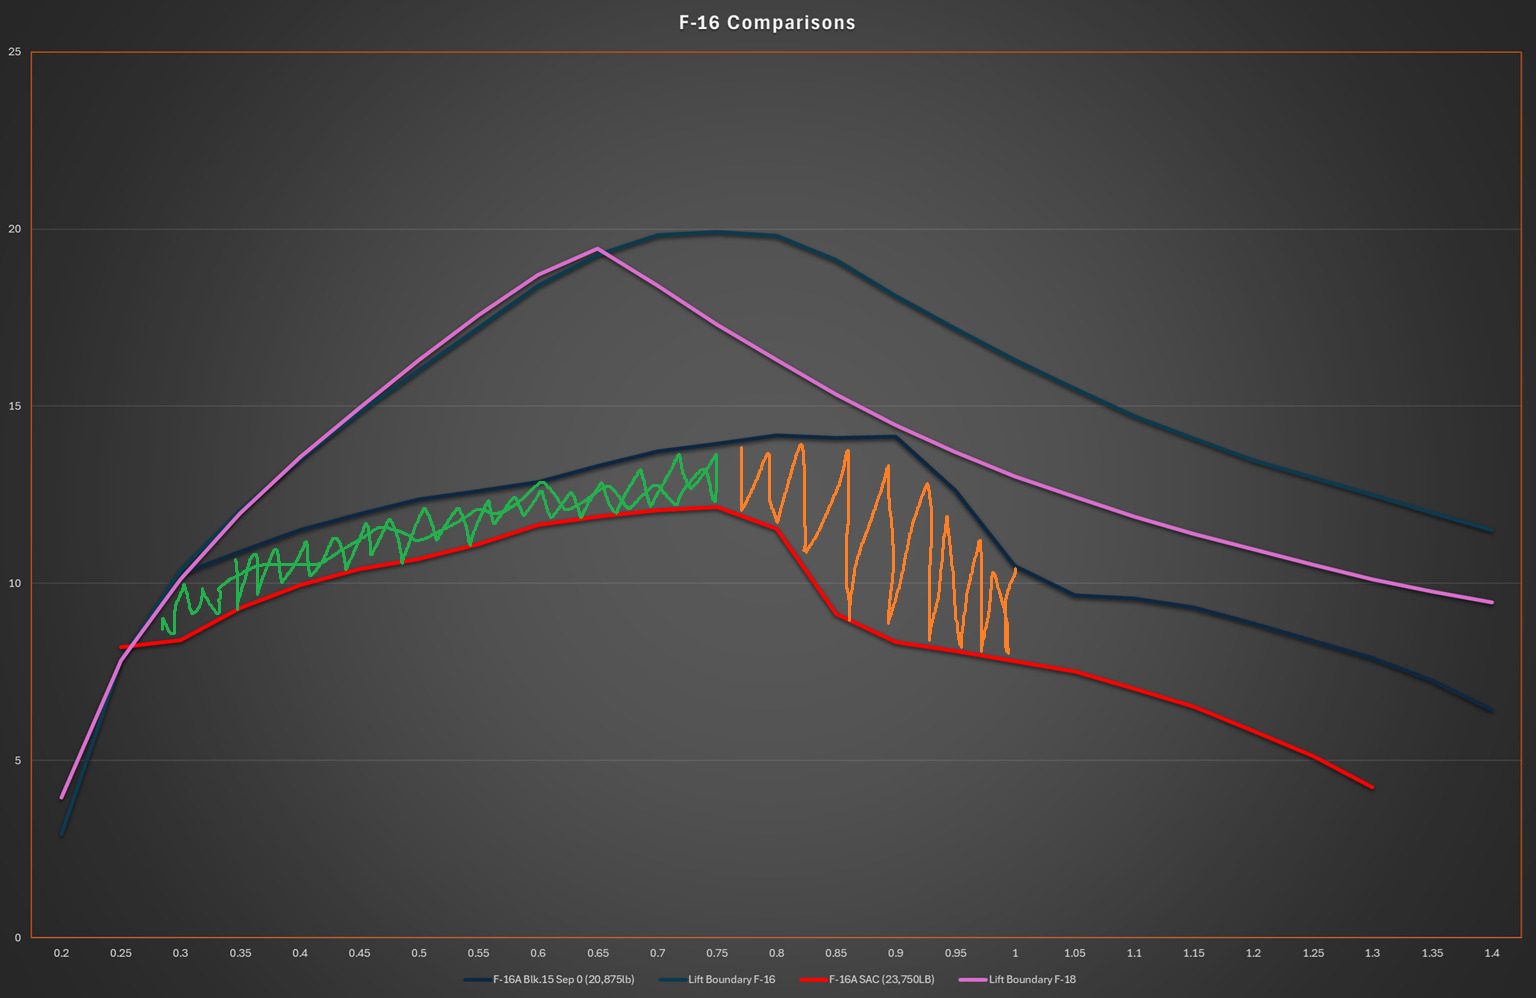
Breaking it down Barney style since you tend to not understand things; the region that is shaded in Green is roughly where just a direct correction is somewhat accurate and the orange region is where that direct correction becomes highly erroneous.