the only one that is sharing his personal beliefs here is you
No that’s squish who is doing that.
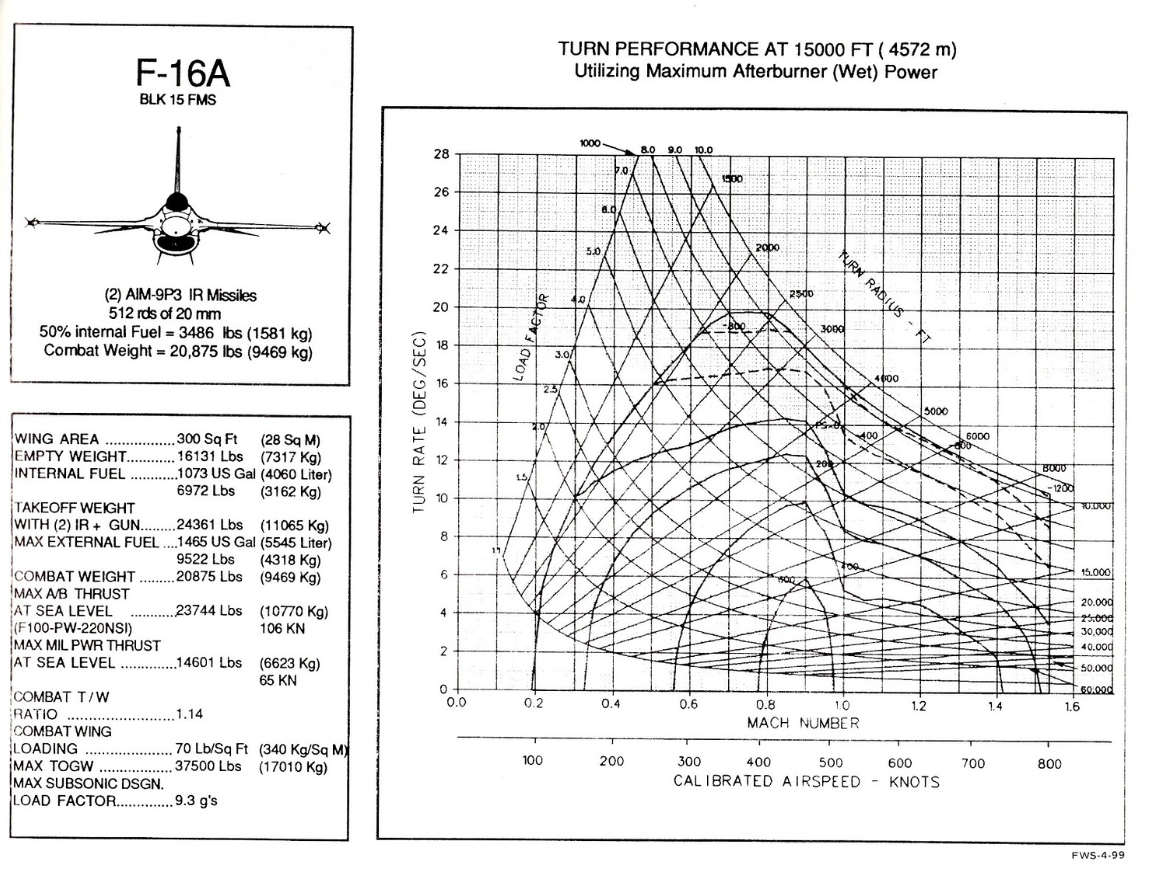
He is comparing a F-16A with 2 missiles and 50% internal fuel
to the F/A-18 with 60% internal fuel and 4 missiles.
What I did is take the weight of the F-16A with 50% and 2 missiles (20,875 lbs) and add the weight of 2 pylons and 2 missiles (875lbs) this makes the F-16A with 4 missiles and 50% internal fuel weight 21,750lbs
1 Like
Okay that makes sense then
Yes, I found a chart for the F-16C (Yes I know it weighs more, however its aerodynamically the same and when the F-16C is at 22,000 lbs and the F-16A is weighted up to 22,000 lbs they will perform the same)
This is common sense.
As seen here, this is also for a drag index of 0 meaning there is no added drag of the 4 missiles and pylons that the F/A-18 chart has accounted for.
I then compared that F-16 Chart at the approximate corrected weight to the F/A-18 chart at its approximate weight.
1 Like
For the fa18, which variant is that? The a variant, or the c variant (before or after getting the newer engines?)
The C
Its from the CAMS assessment (1994)
1 Like
You did not read the chart or you do not know how to interpret a chart. This seems to be a pretty common issue for you.
Let’s go back and read together. These are the 3 points that I made.

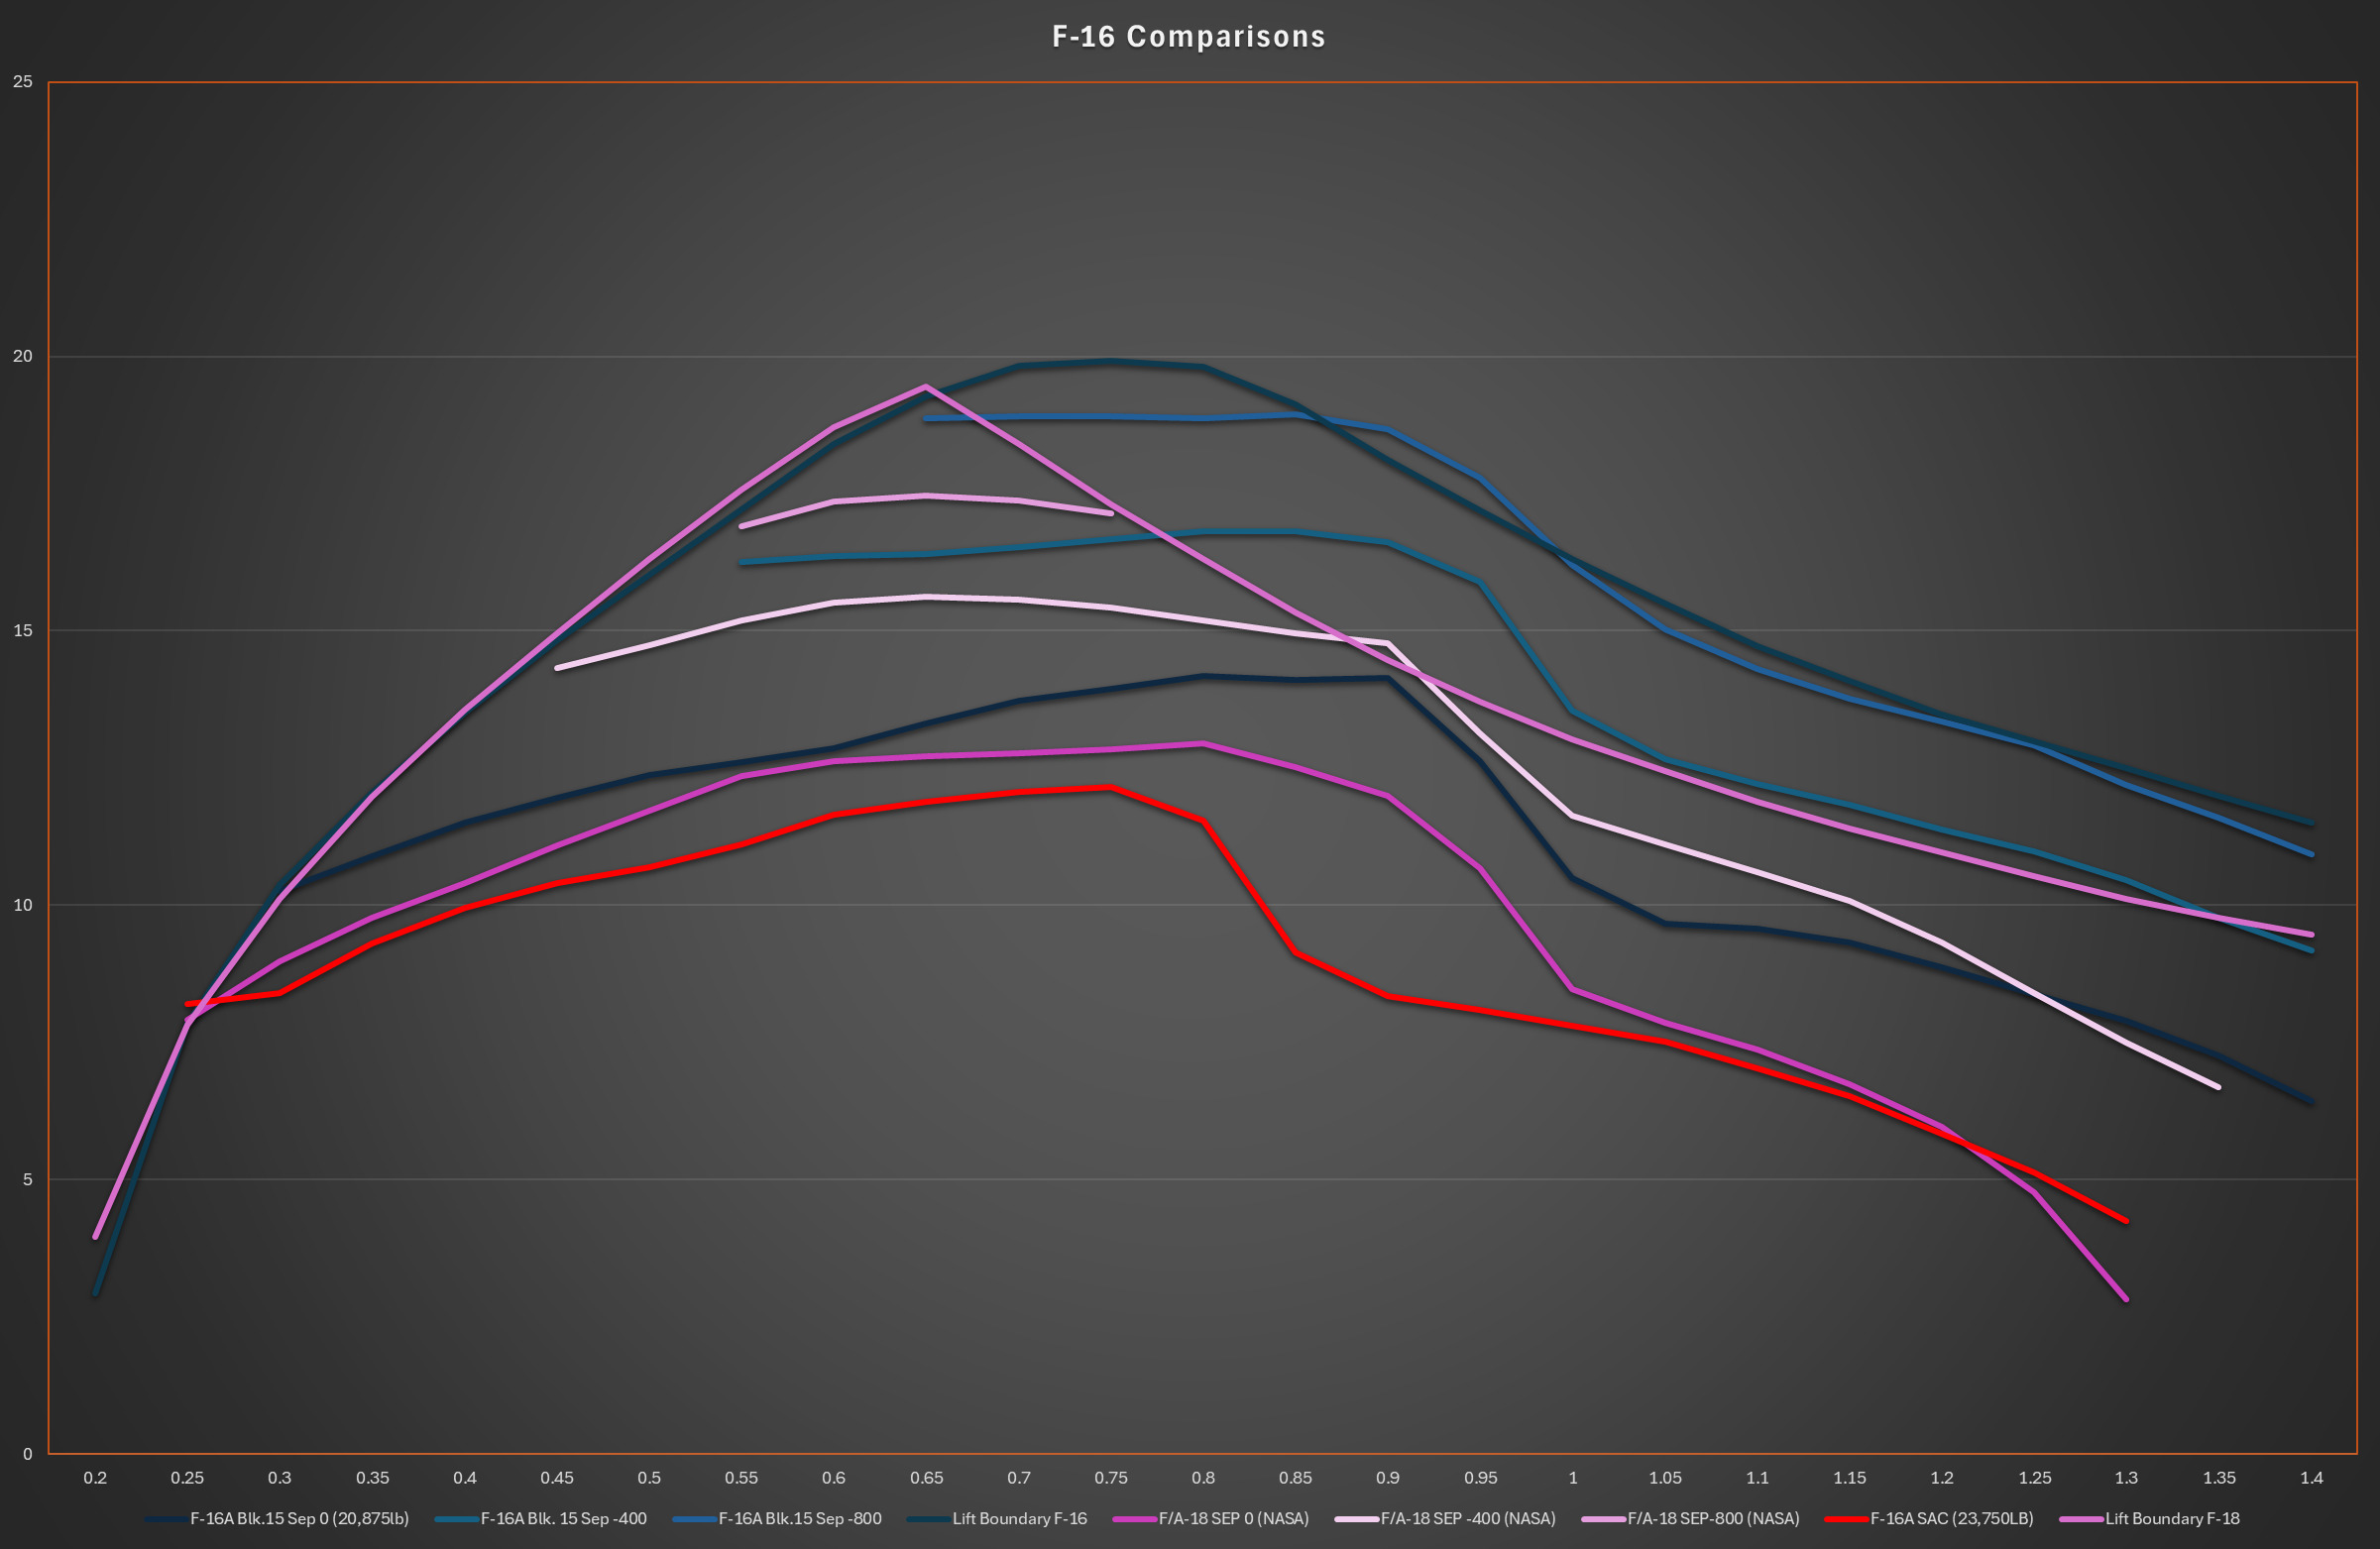
The lift limit lines are for ITR. Nowhere in my assessment did I make any claims about ITR since for all intents and purposes they are very similar. The F/A-18 has a G-limit that negatively impacts its high speed ITR. It is very much slightly better at most G-loadings when compared to F-16A; it will be even a little bit better when compared to heavier airframe of F-16C.
The ESR-D stuff was to showcase that point that it’s only document that I have seen where turn performance is specified at only a specific speed and might not represent best-case-scenario. I also correctly pointed out that the speed that the datapoint is taken at would favor the higher angle of attack limit of the F/A-18 and the fact that the ESR-D values for the F/A-18 are optimistic according to it’s own publisher. Even under optimistic conditions the difference is 5%.
It actually doesn’t.
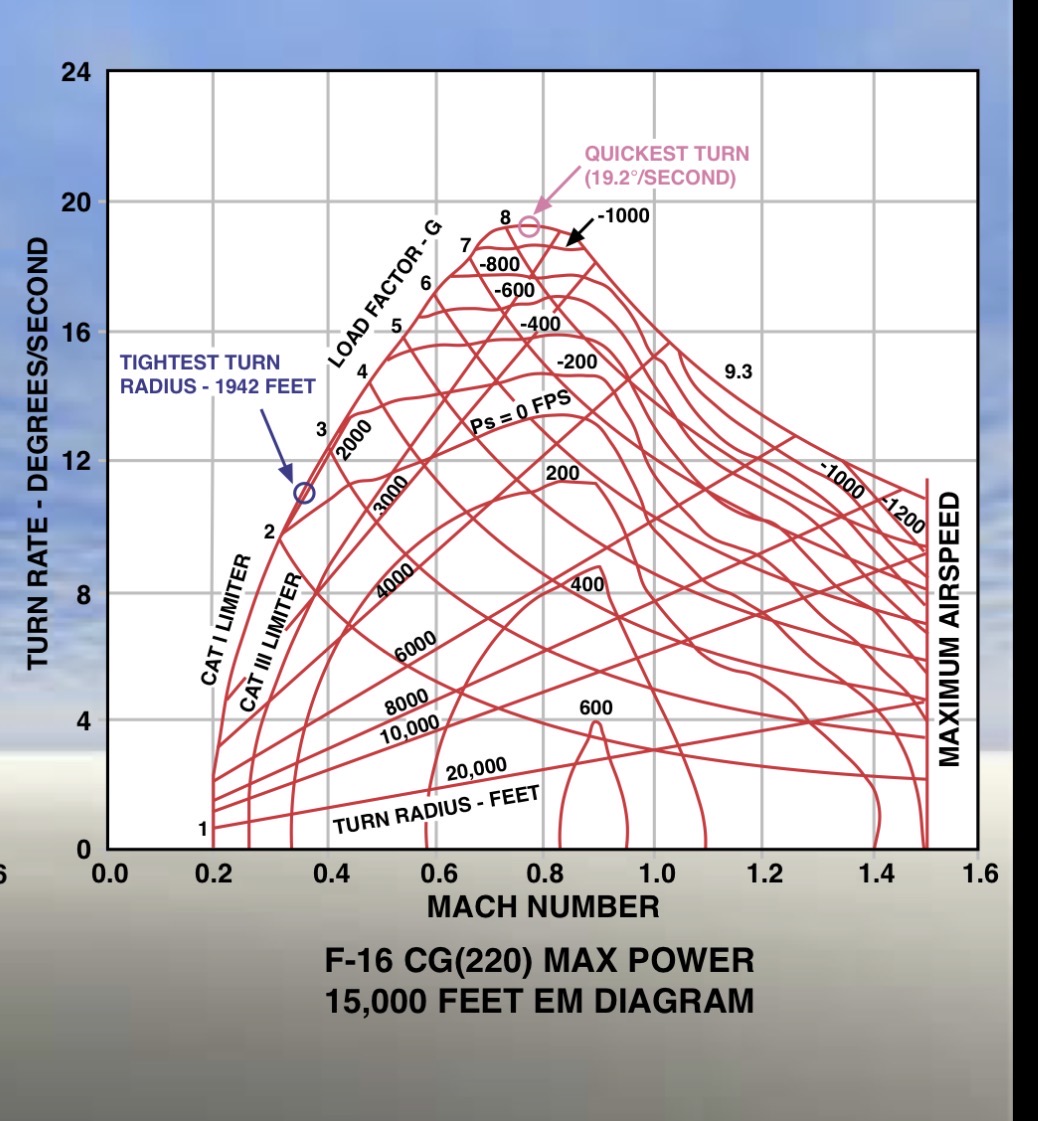
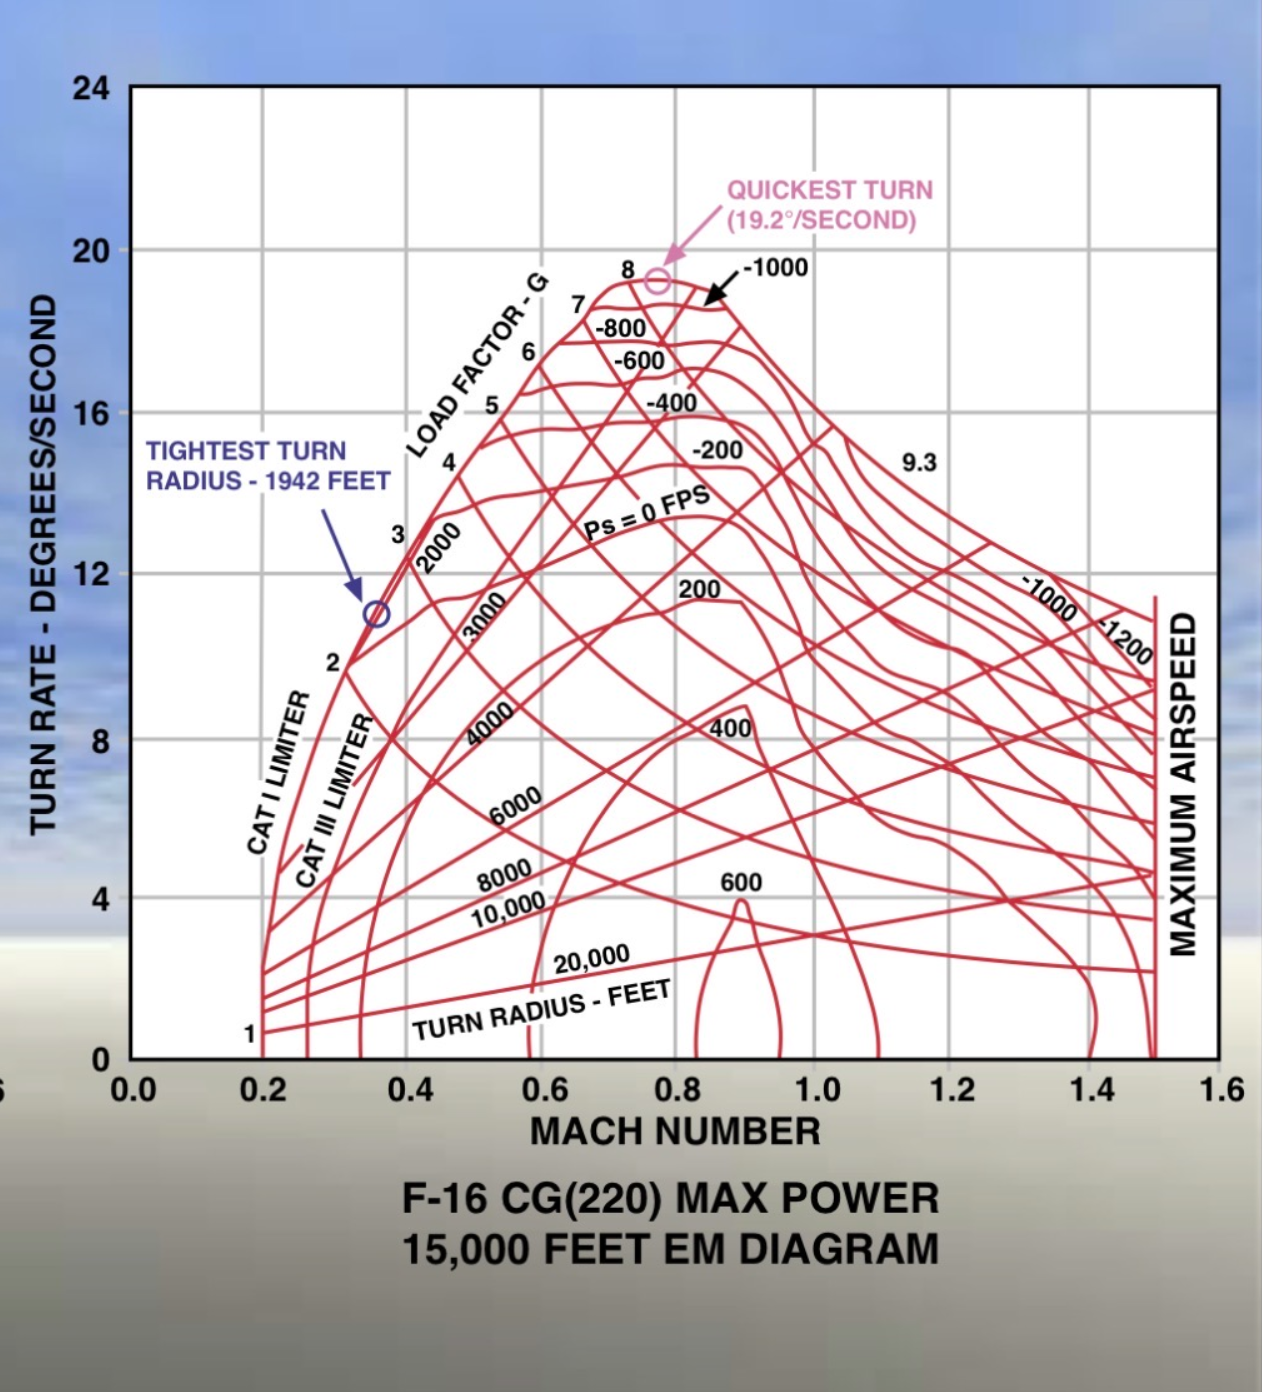
This is the EM diagram that he is using as a reference to make his claims.
Note how I have down a red line at maximum SEP = 0 / STR and it shows that it is 13 degrees per second in this chart. This chart is present in a NASA study and does not specify any kind of missiles or loaded weight; in fact the fully document mentions testing the program being developed on the F-18 HARV.
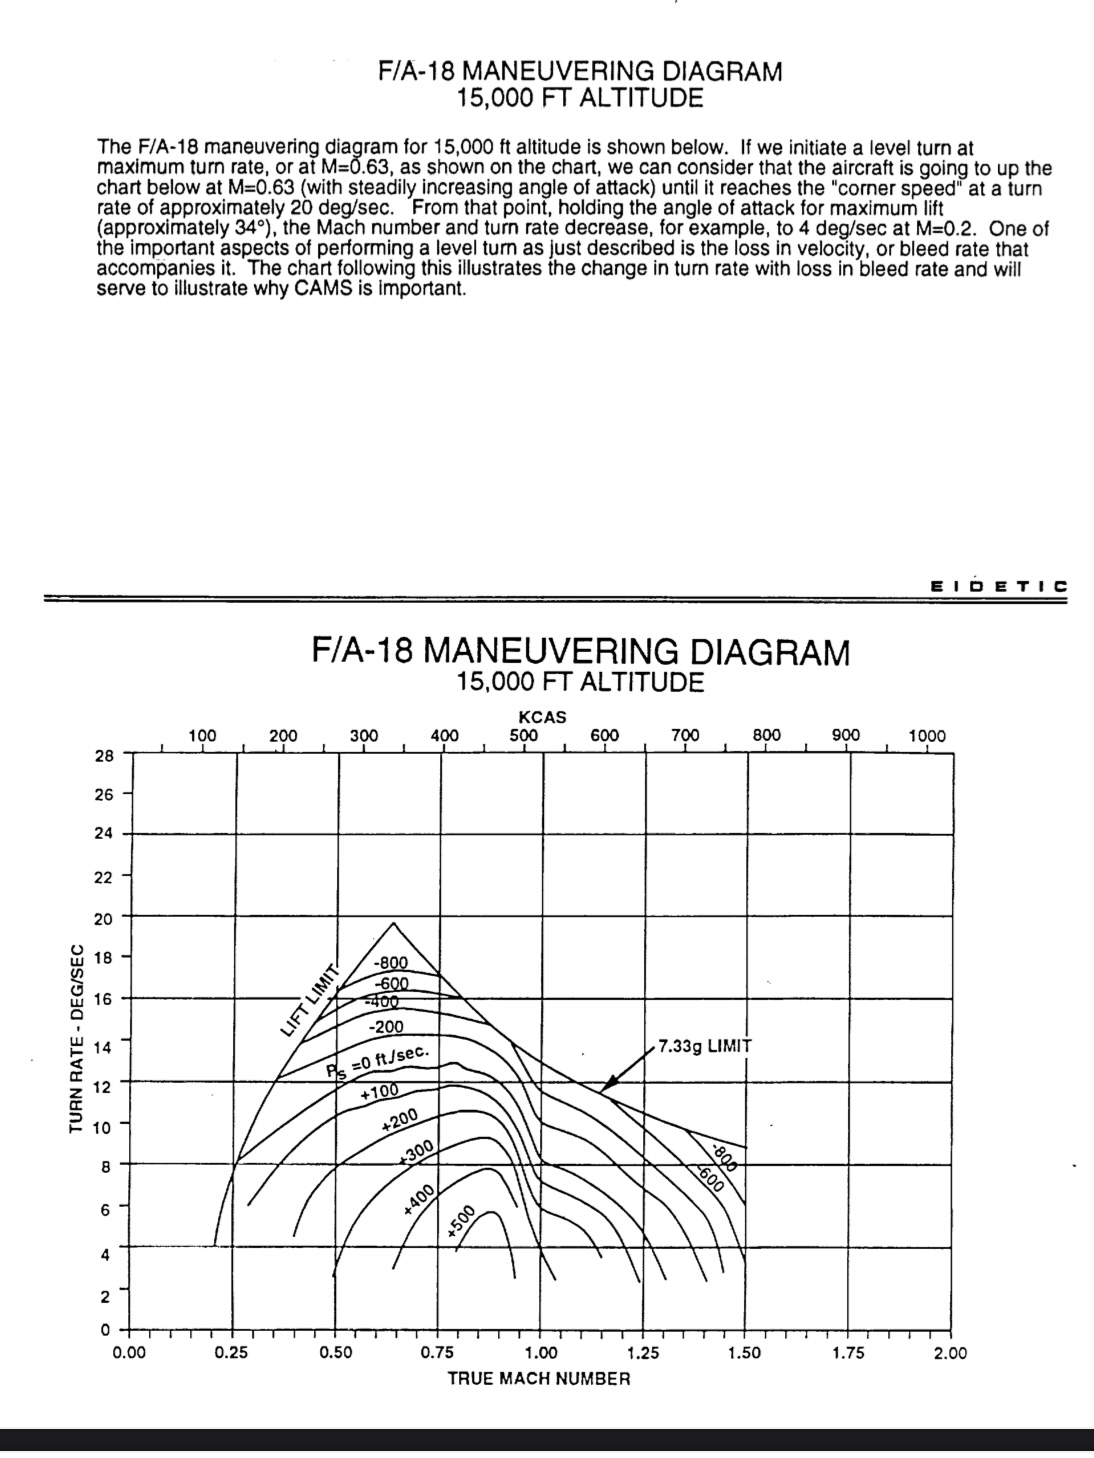
This is the document that pertains to the sustained turn rate figure for 60% fuel, 2 AMRAAM, and 2 Aim-9. These figures are also for an F/A-18C with the upgraded engine.
These are two entirely separate and unrelated documents that are years apart. He has moved the goal posts many times in the conversation.
- He didn’t see NASA EM diagram reaching 13 degrees per second.
Once I pointed this out with the above drawing he made the claim that;
- He thinks GAO report figure is just a generalized number and is inaccurate.
My answer from the beginning is that the NASA EM diagram has higher performance than the GAO figure due to the likelihood that the planes are at different fuel state between the two diagrams. The higher performance in the NASA document indicates that the performance is calculated for a plane that is lighter than the one in the GAO document.
MatrixRupture is insisting that they are actually calculated at the same weight and that 12.3 = 13.0.
2 Likes
Likely same weight with less drag potentially.
This matches the F-16 chart better then as the F-16 chart has a drag index of 0
There is absolutely no indication to what engine the EM diagram in the document is for. It could be F/A-18A, F/A-18C w/ original engine, or F/A-18C w/ upgraded engine.
NASA HARV plane never received the upgraded engine to my knowledge so it is just as likely that the EM diagram is for the older engine. Which once again begs the question…how is NASA getting 13 degrees per second from a plane with weaker engine while the Navy is getting 12.3 degrees with the stronger engine?
1 Like
did the doc state which pahse of the HARV the EM chart is for?
As stated likely it didn’t have missiles. But the difference in stated sustained turn rates is just .7 degrees a second.
So the weights would likely be similar.
The document is developing a controls-law toggle to go through 3 different control modes to prioritize different turning performance metrics; i.e there is a mode for energy retention, one for minimizing turn radius, and one for post-stall maneuvers.
The study itself post-dates most of the famous F-18 HARV tests but also pre-dates GAO report.
1 Like
Nothing better than documents that vagueposts
Its the only F-18 Chart that ive found
The difference between F-16A w/ 2 missiles and F-16C w/ 22,000lb figure is also .7 degrees per second.
I also have figures for other F-16C variants but it is not clear if they can be shared on the forums but the comparison remains largely the same.
1 Like
i meant the NASA doc
becasue the HARV had 3 phases iirc
1st phase was basically an unmodified f-18
2nd phase they gave it TVC
3rd phase they gave it movable stakes to controll yaw at high alpha
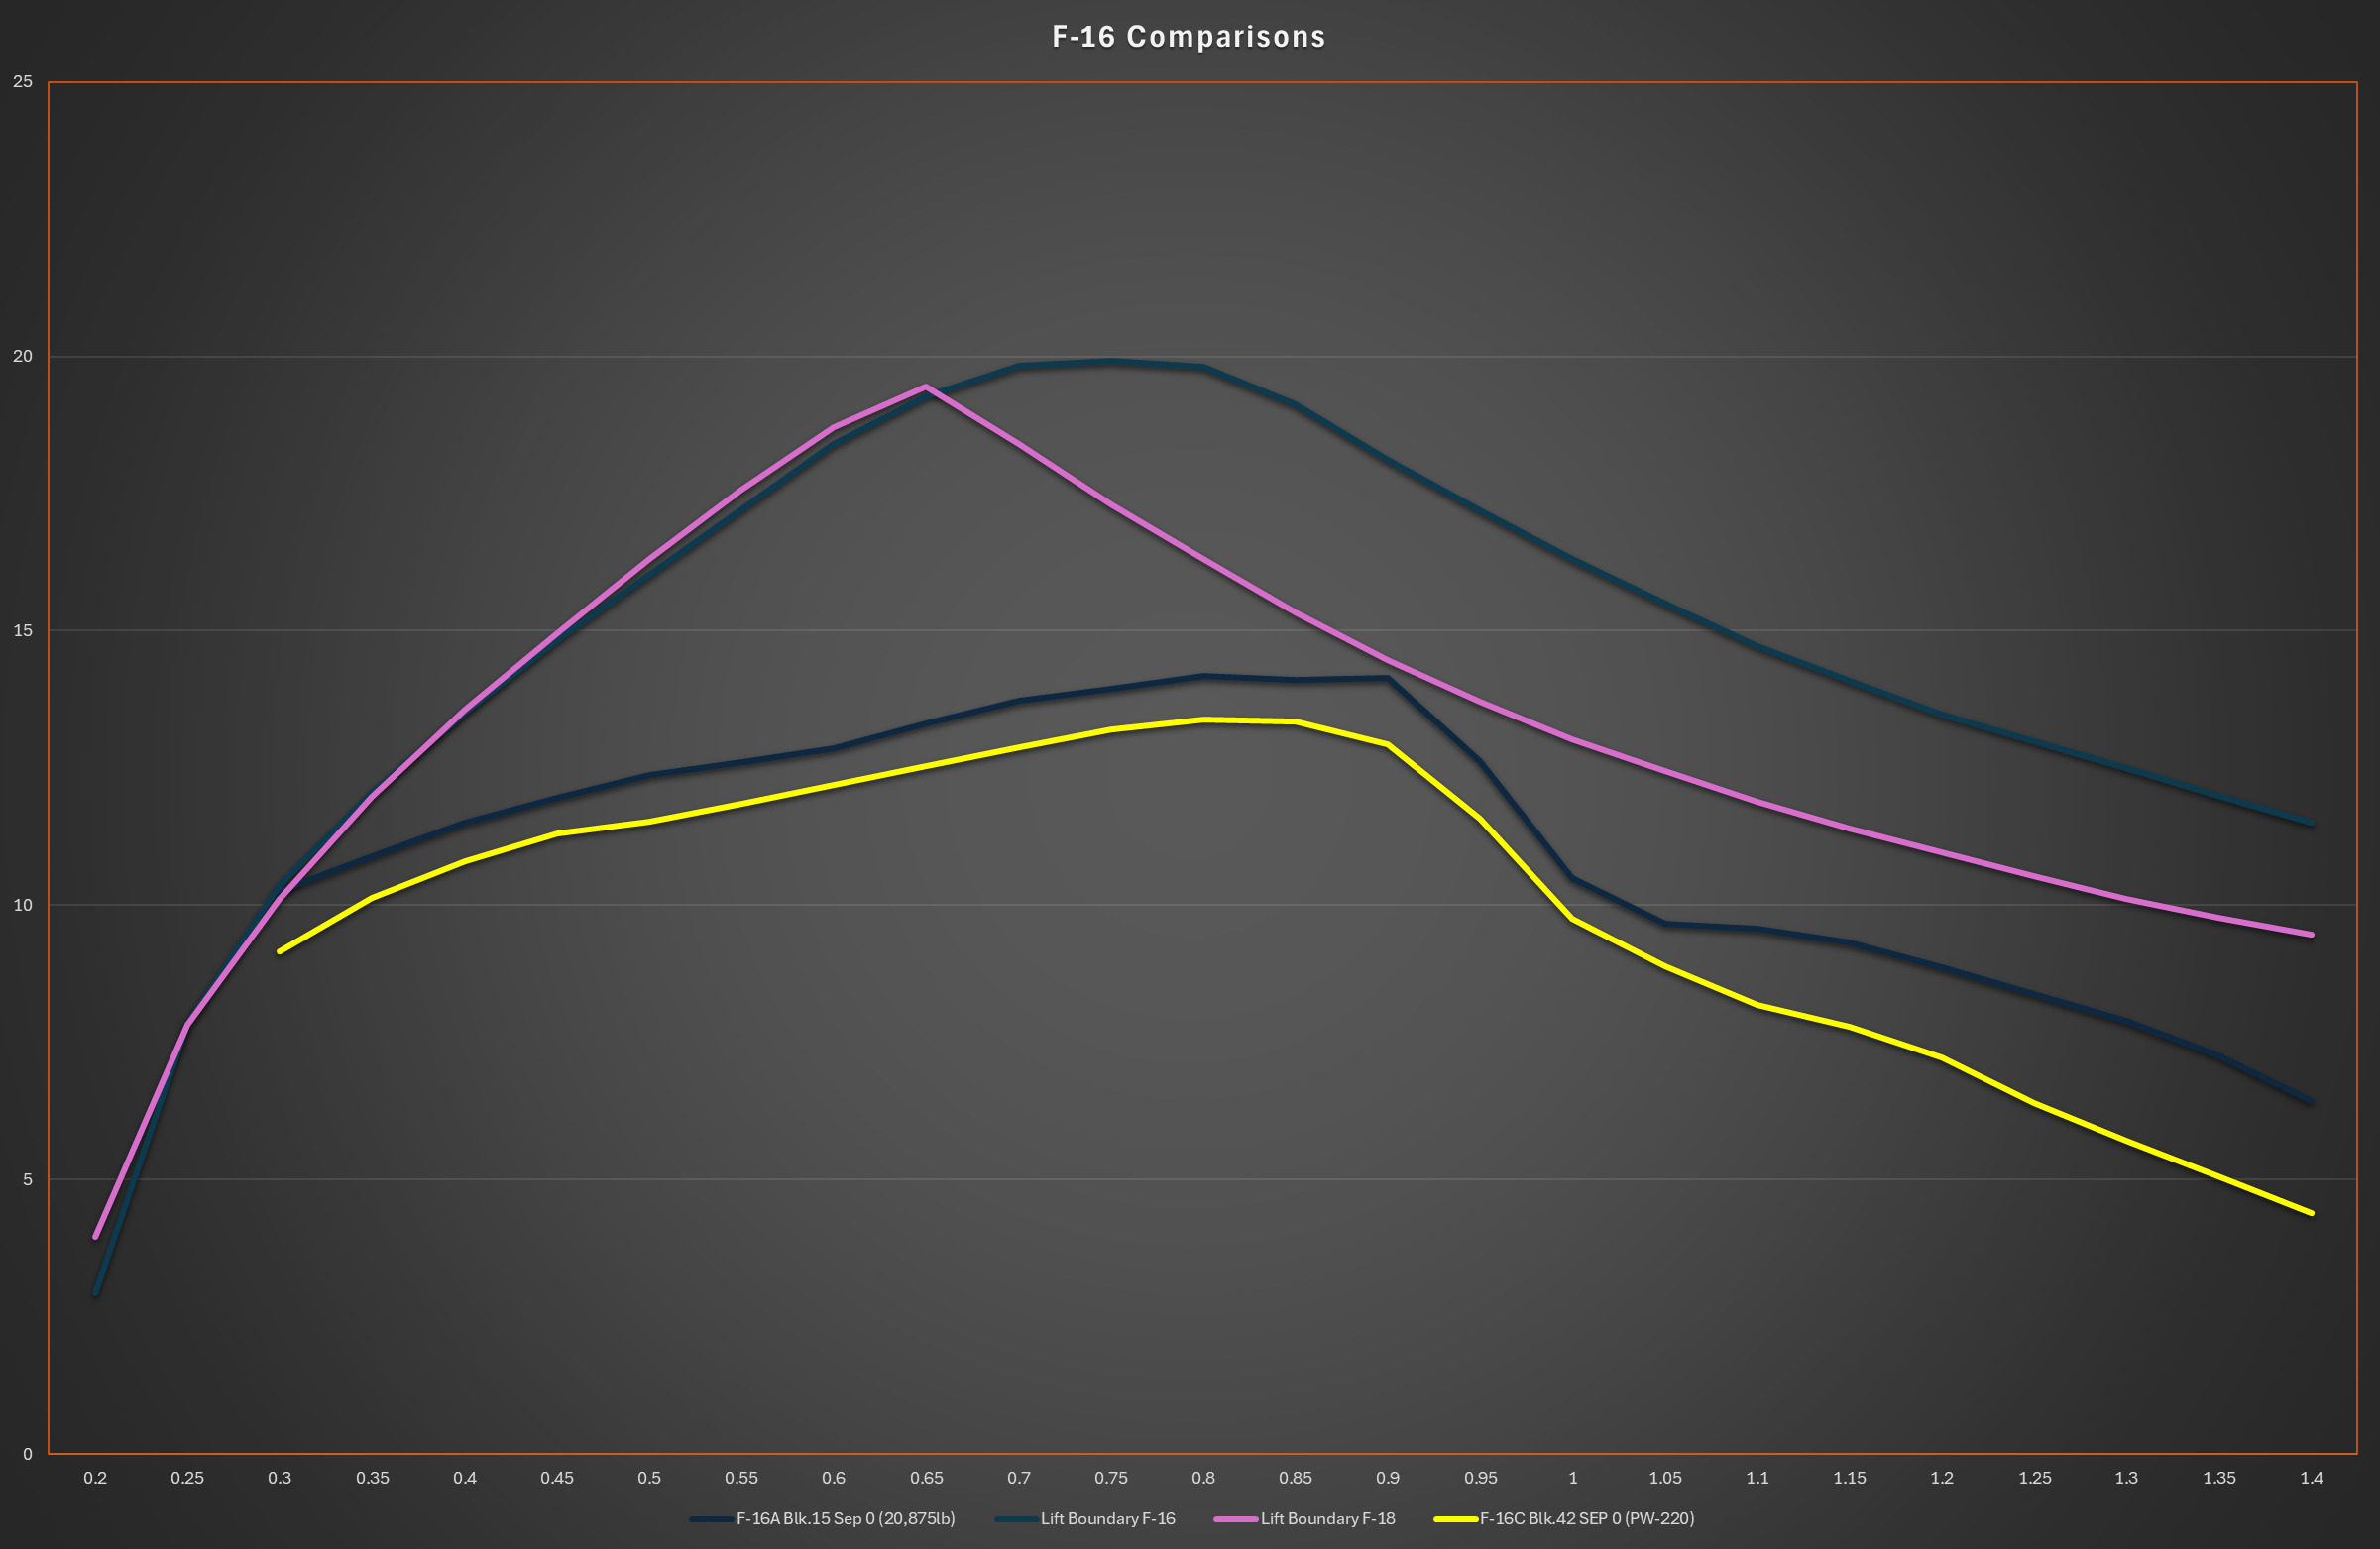
This is a direct comparison of the STR figures in both charts. It approximately .7 degrees per second difference through most of the subsonic speed range. We can nitpick the extreme edges if we want but the diagrams are from separate sources.
The model is based around the baseline F-18
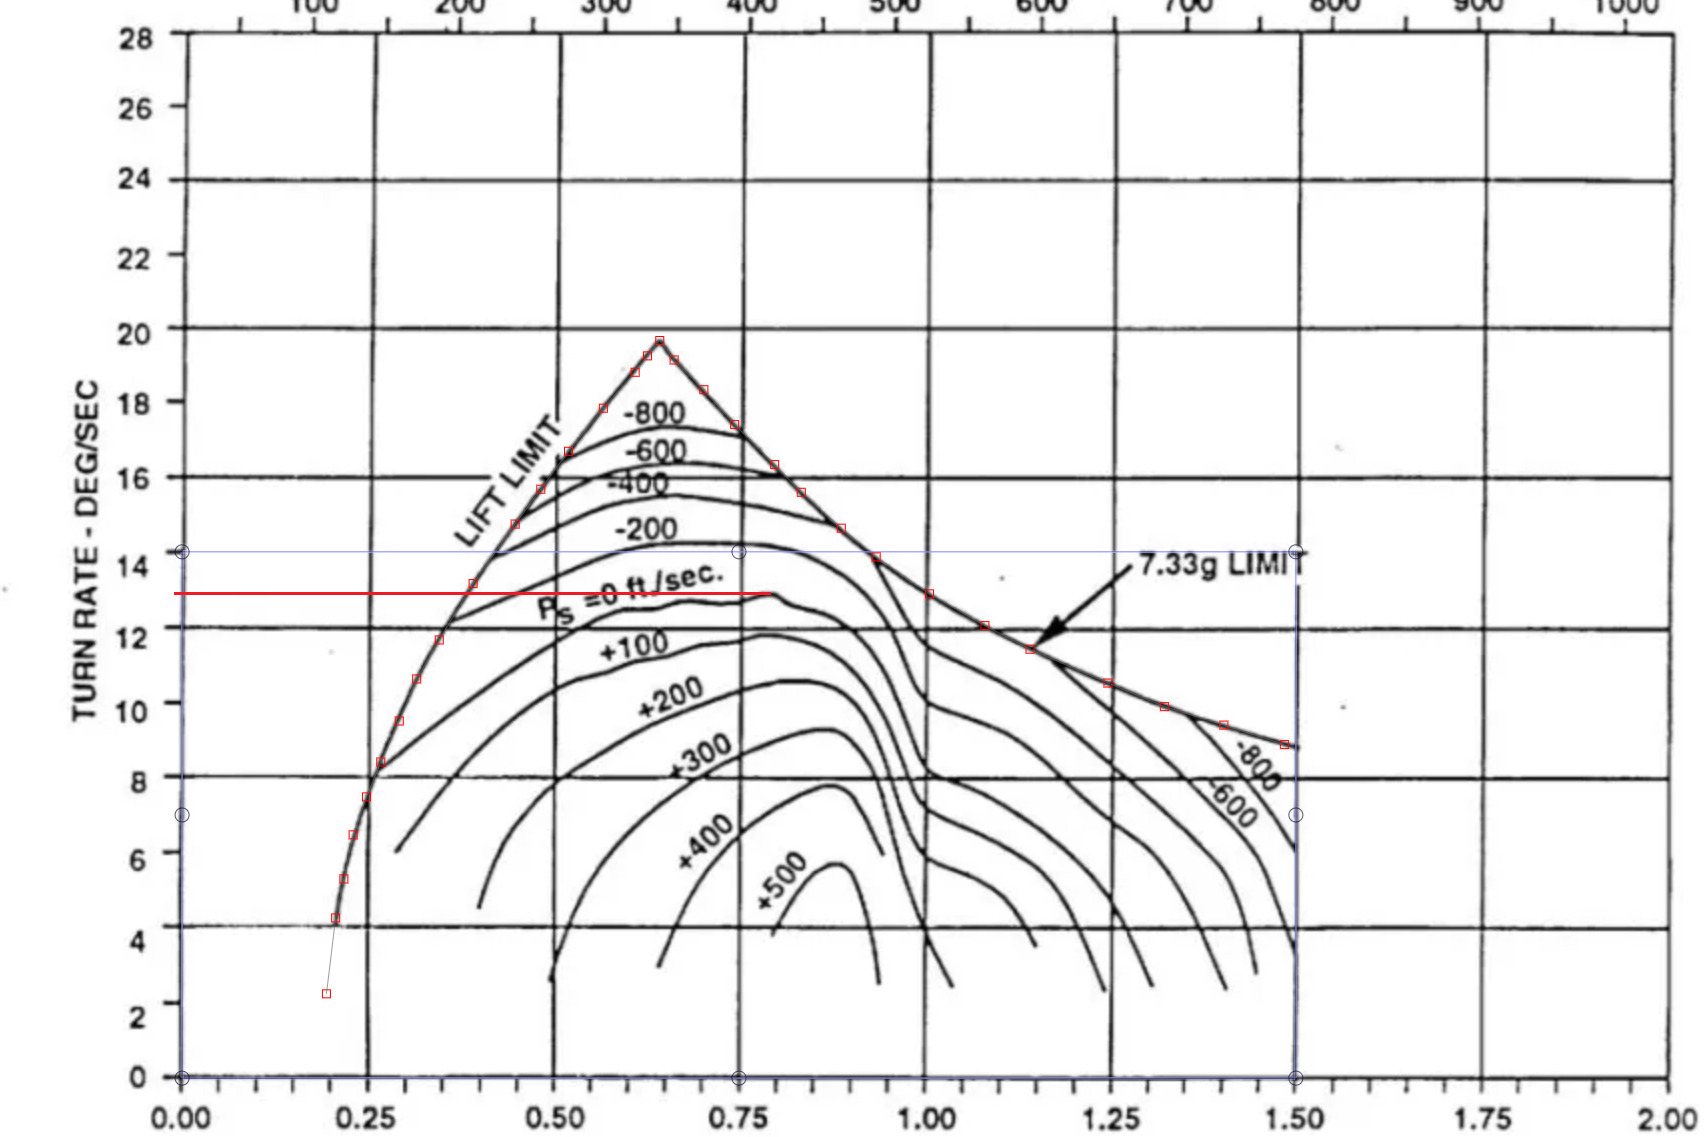
That looks nothing like the 2 charts
The ITR also look improperly matched
.6 Mach there should be like .25G difference