Wrong, They never specified any data for the A so no.
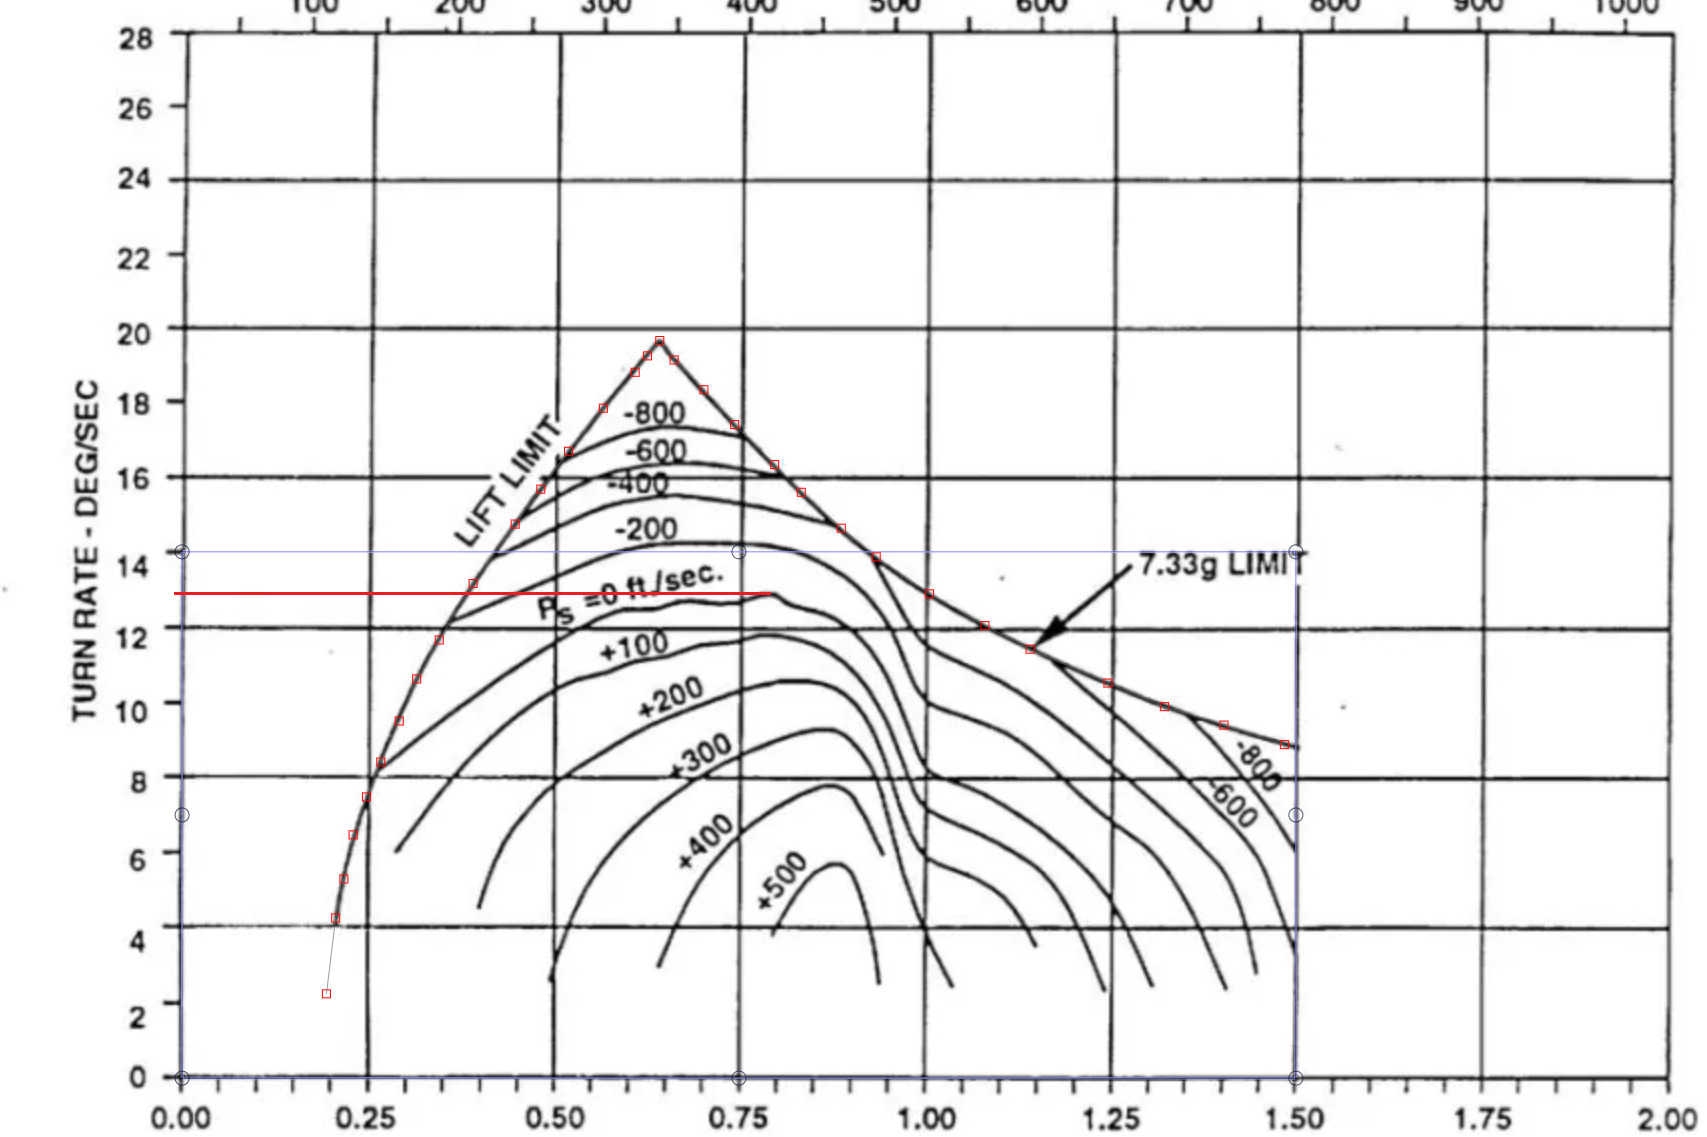
The 7.33G limit for a weight of 33,000 odd pounds when 60% fuel and 4 AAM is used.
This is not specified in the NASA document where the EM diagram you are referencing is sourced from.
The turn rate figure that corresponds to the 60 percent fuel + 4 missile load out comes from a GAO report.
Why is the turn rate figure in the GAO report significantly lower than that found in the NASA document?
Its 12.3 like in the graph
It is not 12.3; it’s nearly 12.95 in the NASA graph.
Also should be kept in mind that the GAO numbers are figures for F/A-18 with upgraded engines so a best-case scenario in terms of turn performance.
The figures in the NASA graph are for a lighter airplane than those in the GAO document.
Do you think that the F-16C airframe is the same empty weight as the F-16A airframe?
Obviously not, they never specified any data for the A chart.
So ill explain it to you one last time, see if you can comprehend.
The F-16A with only 2 missiles and 50% fuel weighs about 20,875 lbs according to your source. So add the weight of 2 AMRAAM and the 2 pylons associated with the carriage of the two missiles. After that is added the F-16 will weight more than 20,875 lbs.
AMRAAM weighs 350 lbs or so (700 lbs for 2) pylons maybe 175 lbs for both (estimated, based on harrier gr1 dual inboard pylons being 154 lbs)
700+175= 875 extra pounds for the addition of 2 missiles and the associated pylons.
F-16 50% fuel and 2 winders = 20,875 lbs + 875lbs = 21,750 lbs
21,750 lbs for the weight of the F-16A with 4 missiles and 50% internal fuel.
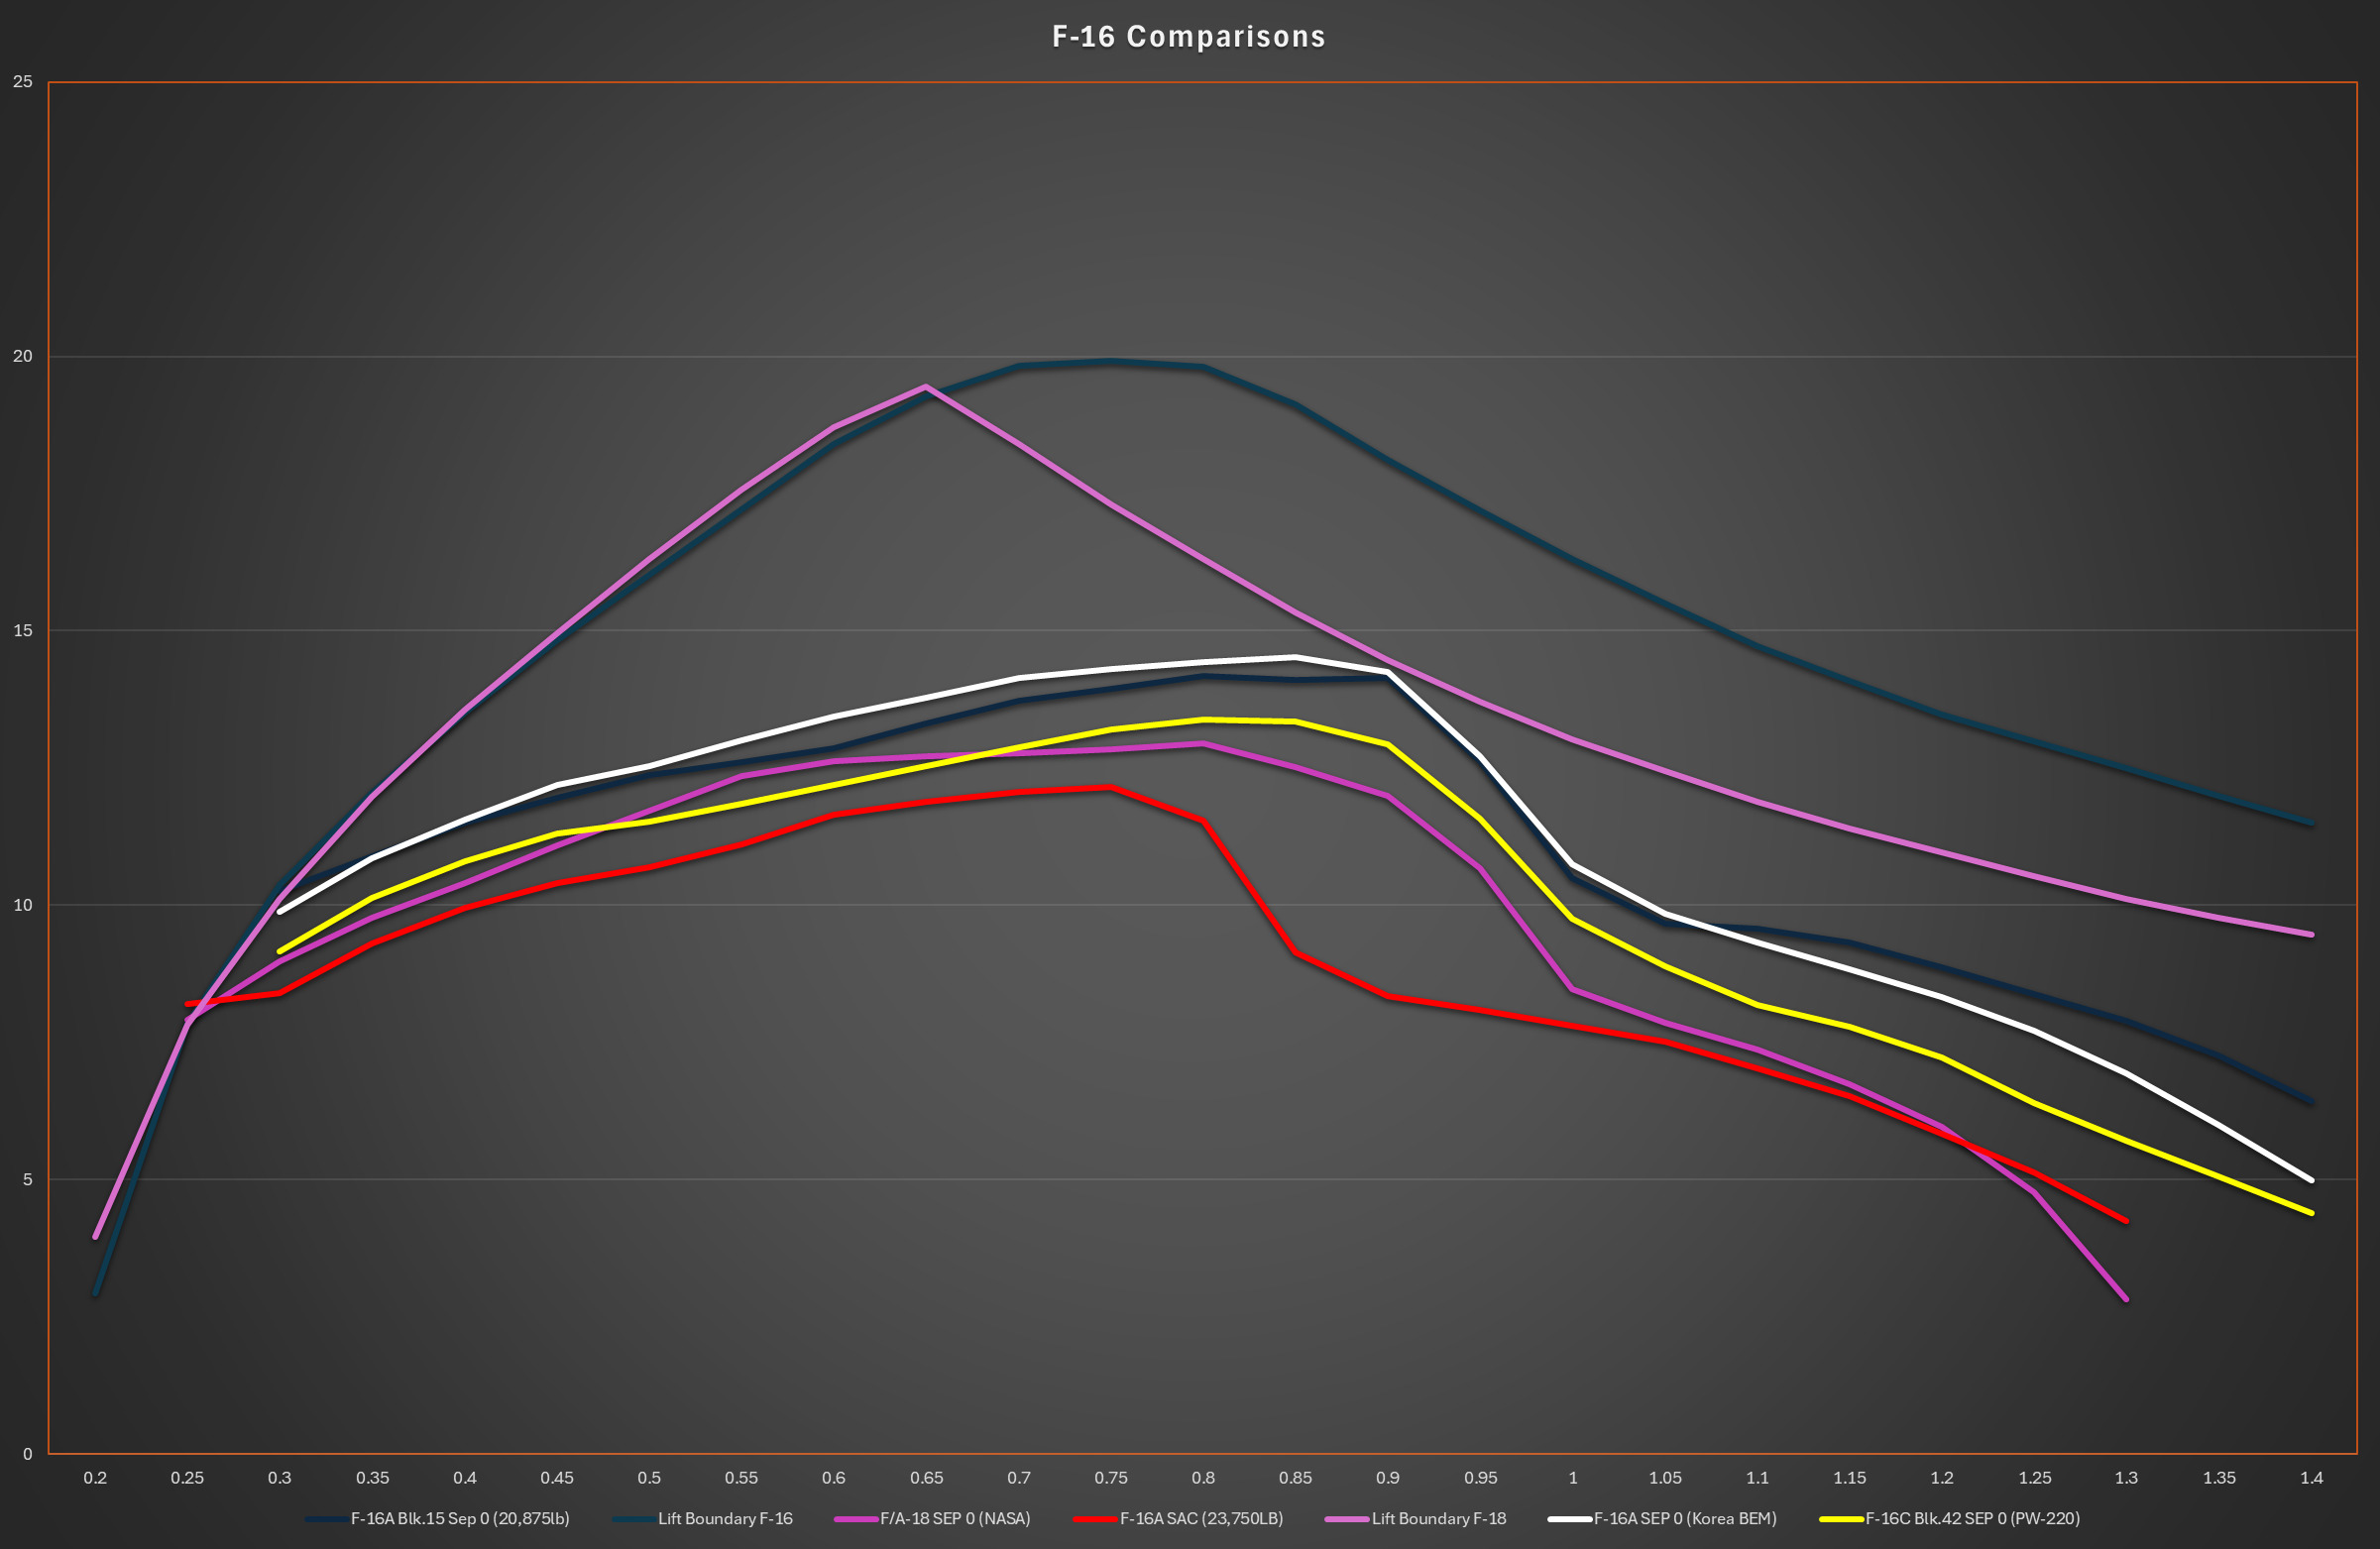
Ok and? The data for the F-16A chart is very close match to the other F-16A chart at 50% fuel and 2 sidewinders. The NASA F/A-18 chart is also at lower weight than the figure that is available in the GAO article.
The NASA F/A-18 chart shows an initial turn rate of 19.4 degrees per second.
The Korean F-16A chart shows an initial turn rate of 20.1 degrees per second.
The Korean F-16C chart shows an initial turn rate of 19.2 degrees per second.
The FWS F-16A chart shows an initial turn rate of 19.9 degrees per second.
Once again we get back to this.
Throw in numbers for PW-229 or GE-129 equipped F-16C and the STR numbers improve significantly for the F-16C.
Now compare that weight with the charts we have,
1 Chart at 22,000 lbs one at 23,700 lbs
The ITR for the 22,000 lbs chart is 19 D/S
for the 23,700 its 18 D/S
What do you think the 21,750 Lbs aircraft will achieve in ITR.
Bro can’t comprehend anything.
Where are the 2 extra missiles that the F/A-18 are carrying for comparison??? Along with 10% extra internal fuel volume???
Youve compared this
F-16A 50% internal fuel and only 2 missiles
too the F/A-18 with 4 missiles and 60% internal fuel.
This is a bad comparison.
Why don’t you just look at what i said at the very beginning.
F-18 has slightly better ITR at 7G and below, and slightly better sustained turn rates at lower Mach numbers. The F-16 is better at the higher Mach numbers.
The F/A-18 EM diagram that you posted is not for a plane with 60% internal fuel and 4 missiles. The turn rate shown in the diagram is nearly 13 degrees per second. If it was for 60% fuel and 4 missiles then it would show 12.3 degrees per second.
Did it specify what speed 12.3 was at?? The Average sustained rate in the chart I should is very very close to that.
I personally don’t see it reaching 13.
Seems like you just like to argue for no real reason. Or you have some crazy cope love for the F-16
The GAO report only specifies an altitude and a weight. Do you think that the GAO report somehow just decided to quote a max sustained turn rate figure that was below the max sustained turn rate?
What is a number that is halfway between 12 and 14?
You are the guy that saw data from real EM charts being compared directly against one another and said that the F-16 is over-performing in real life.
A lot of reports have done this. Where they will specify values for certain Mach numbers instead of the overall maximum.
Yes and I was correct you tried to compare two incomparable data points. (typical of you)
They do not specify the mach number in the GAO report. This is purely speculation on your part.
The only place that I have seen sustained turn rate tied to mach number is in British Eurofighter documents.
How are they incomparable?
The NASA document is from 1994.
The GAO report is from is from 1996 and concludes with the recommendation that the Navy purchase more F/A-18Cs with the more powerful -402 engines.
How is NASA getting better turn performance than the Navy is? Or is the Navy just lying to the GAO?
The answer is pretty obvious as I have already explained to you multiple times. The EM chart likely corresponds to a plane with 50% fuel and 2 Aim-9 missiles. This is a pretty common comparative benchmark at the time.
This coming from you is pretty ironic. Aren’t you the number 1 harrier cope lover on this forum?
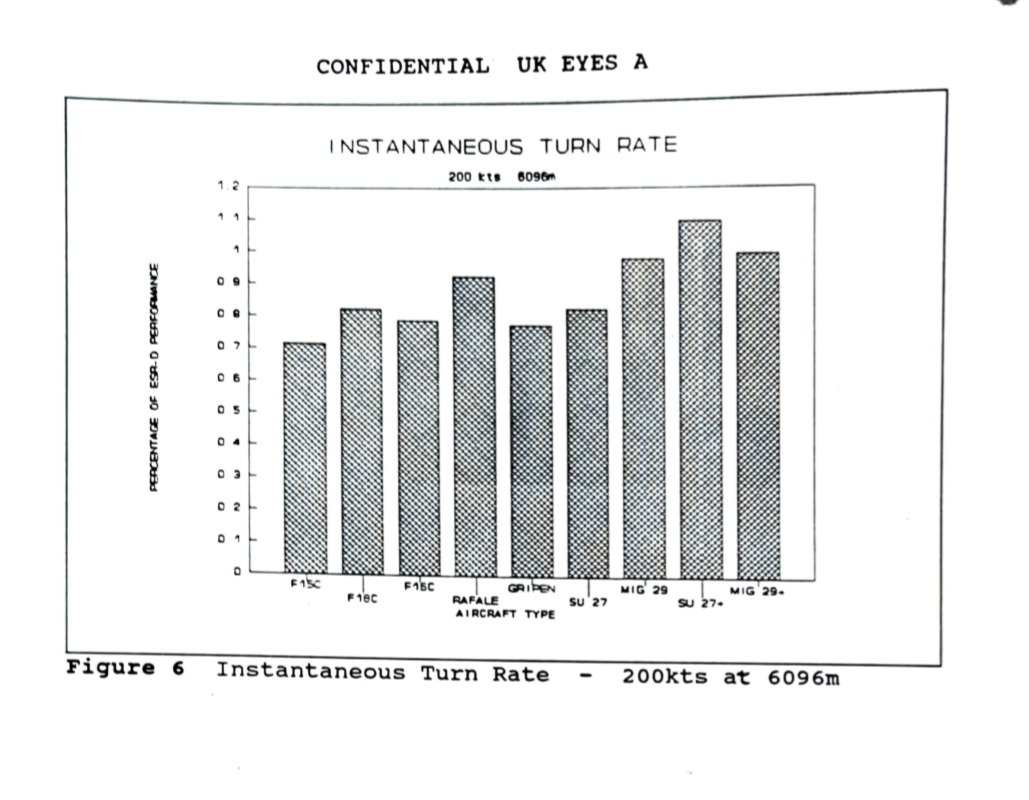
Just to showcase another data-point.
This document shows F-18C having 5% ITR advantage over F-16C. However this is at a higher altitude and at relatively slow airspeed which is comparison metric that will favor F-18s higher angle of attack limit.
In what configuration.
Except I don’t cope I just give relevant documentation and values.
I don’t make up stuff, nor do I use incomparable charts.
You like to compare 85% fuel weight F-16 against 50% fuel weight F/A-18 and then accuse other people of making poor comparisons.