Data Analysis #3: The arrival of Statshark answers some old questions

Yeah I’d think 2x is more realistic than 3x. It will always be a very small part of the game compared to other modes.

I think RB probably has more space to grow here. It’s not just the aiming changes; it’s that in the other modes, there’s significantly more players in RB and that proportion grows the higher tier you go, so AB is acting as the gateway and RB is what you eventually switch to.

Naval has pushed against that trend for a few reasons. One was RB was a poorer experience than AB for a long time, too heavily botted (both by Gaijin and cheaters), making the air side unplayable whereas in AB it was mostly human players, so AA was much easier to deal with, and you made more cash because human players earned you more.

So what’s changed since Jan? Bots were added to Naval AB by forced 16v16, removing that advantage for planes; bots earn the same as player kills now and higher rank bots were introduced, so rewards in RB are significantly higher than AB now; and most recently AA was heavily nerfed. AB was hanging on since March in top tier only, the inverse of where a starter mode should probably be focussing; now we’ve seen RB top tier numbers actually pass AB with this latest update. (Also they haven’t slacked on the fighting cheaters, NRB is really cleaned up now compared to two years ago.)

Would it be a net win for Gaijin if naval RB continued on the current track and grew to 2% of matches and took over the higher tiers like the other RB modes have, even if AB didn’t grow or sunk a little and became the entry mode like in air and ground? Possibly? What’s looking now like stagnation could just be inversion in popularity, with growth in one mode obscuring loss in the other, that’s what I find interesting about the mode.

Is that another way of saying NRB is “getting all the love” right now, and players are responding? Probably…? What I can’t decide if that’s Gaijin’s deliberate strategy or not.

1 Like

for sure, that’s why Soyz, Iwoa, Yamato got better rewards in NAB.

image
image

Keep in mind that what you see here are only the rewards earned from actions. In Arcade there is usually more action than in Realistic, so rewards from actions are often higher. But there are also mission rewards, which are not included in these stats, and they are higher in all Realistic game modes due to better multipliers.

In general, I would say that the final rewards (action + mission) are similar in both Naval Arcade and Naval Realistic game modes. This is the only game mode where that’s the case. You don’t need to worry about the rewards in Naval game modes - just play whichever one you prefer.

Yeah, I would agree they’re comparable now, or RB could be slightly higher on net.

That’s a big difference from last year even, when RB rewards due to bots being only rewarded at 1/3, meant RB was about a third lower than AB.

One can always cherry-pick data to find some RP deltas where RB is lower (but much closer than it was before). One could just as easily point in this month’s data to Amiens (RB 28% higher), SKR-7 (RB 68% higher), Frank Knox (RB 136% higher), Scharnhorst (RB 26% higher)…

Average score is also notably higher now in RB… 1186 across all players vs 1124 pre-multipliers. On net an average game in RB earns 22% more modified score than an AB game.

Events actually have very little effect on games played it seems. At most it seems to be a multiplier (with current players playing more).

What does have a disproportionate effect is the Battlepass vehicles challenge, especially if it has to be done with a naval vehicle.

Just some fun stats to share, which help prove the point:

June to March doesn’t allow us to drill down too far because of all the naval BR changes, but they’re perfectly good for comparing other things. Here’s some stats on all AB/RB games played by everybody, broken down by mode and nation, comparing March and June.

Spoiler

The chart shows total user sessions (1 per player per game, so < “flyouts”) in June and also in March. “Change” shows how much they changed March to June in absolute numbers. “% of total” shows how much of the June sessions were in each mode and country. “% change” shows the March-to-June change results in relative numbers.

So what you see here is that the Ground RB growth I’d previously commented on is happening at the same time by a significant decline in air games. This is despite the fact that in March you had the Strasbourg and FIAT events, and in June you had half the HF-24 and the T86 event so if vehicle events made much of a difference, we should have seen higher air in June relative to March and lower ships. But it’s the reverse.

(Also surprising to me was how strong Japanese ships is now, comfortably beating out Britain).

But the outlier here to look at is French naval AB in June, the second-highest percentage growth other than Japan in naval RB. That HAS to be a reflection of all those Amiens being played for the Battlepass challenge. Basically all of AB’s growth March to June is in the France column (there were 230k AB and 107k RB games for the Amiens all month, according to Statshark, so about 2/3 of all French games in June in AB and 1/2 of French games in RB). It’s a strong indicator that those Battlepass challenges have a lot more to do with attracting players to naval and keeping naval alive than the vehicle events.

Overall user sessions by country, in case anyone was curious about how that’s been changing too:

June March Change
USSR 64,278,376 70,993,155 -6,714,779
Germany 61,857,553 58,849,728 3,007,825
US 59,424,649 64,825,359 -5,400,710
China 14,685,691 14,856,893 -171,202
Sweden 13,923,438 14,167,356 -243,918
UK 13,643,230 14,235,810 -592,580
Japan 12,751,081 13,990,058 -1,238,977
France 11,947,816 14,150,264 -2,202,448
Italy 7,538,143 8,097,048 -558,905
Israel 5,587,453 5,110,385 477,068

Overall games played (AB+RB)… UK drops from #5 to #6.

(Come to think of it, those somewhat over 300k Amiens games also gives you a pretty good idea how many players do Battlepass intensely enough to have to do that challenge… if it was, say, 15 games to get the BP challenge done, means currently about 20,000 hard core Battlepass players, +/- 50%?)

For RP nope, AB got better with arrow researching which multiply ALL gains(eve) on 1.3 in NAB and 1.1 in NRB.

I realise this response is about a month old but my guess here is, its all the Naval AB players moving to ground since their mode was killed off.

Check the chart in my last post, it may give some ideas.

1 Like

image
image

Can you point where?

Also, activity% is calculated differently for AB, RB and SB.

Going off of Air, AB requires significantly higher ratio of score to time alive to get the same activity% as air SB.

And activity% is the most important stat for rewards due to

image

For me as an ASB player, air vehicle events usually lead me to taking weeks’ long worth of break because of the mode getting flooded with zombers and people who leave after 1 death leading to constant lobby hopping to find a fun game.

He’s talking about how if you are researching the next vehicle in a tree in RB you get a 10% bonus on modified RP, and for AB it’s 30%.

Just a graphic depiction of what I’m talking about, above. Comparing the number of player sessions (games) added to the June stats by people using their Amiens to finish the Battlepass seasonal task, to the number of sessions added by ALL the new Leviathans top-tier ships together (counting all games 8.0 and up) in the last six days of the month gives us this:

Both ARE still positive effects on the amount of naval games. Amiens players added 8% to Arcade and top tier players added 2.4% (in only the first week… figures for RB are 5 and 4% respectively). Battlepass is still the biggest thing Gaijin is doing to encourage more people to try naval. But how many of those Amiens players do we think will come back to AB next month with no Battlepass task for them to do that can only be done in naval with one specific ship?

(As always, figures from Statshark).

You have to remember that we also had another challenge requiring players to destroy planes using a coastal vessel, and many players chose to complete both challenges at the same time. The result can be seen in these threads:

This challenge caused a lot of frustration among players, primary due to a previous change in the game, where AI bots had very high (basically pinpoint) accuracy.

What I don’t understand is this: the developers (e.g. on the Russian dev streams) keep saying they actively play the game. Yet somehow, it took players talking about over-accurate AI bots for nearly three months before any action was taken. And the fix itself was likely as simple as adjusting a few values in the code (e.g. vertical and horizontal accuracy settings). Something that could have been done in minutes ended up taking months, and what’s worse, many detailed bug reports were dismissed with a “not a bug” response along with advice to submit it as a “suggestion” on the official forum instead (and we all know that this path takes years before it even reaches the developers).

How is it possible that so many Naval players immediately saw this problem and reported it, but somehow the devs and bug moderators, who claim they play the game as well, didn’t see anything wrong with it?

And then, three months later, we see this in the changelog:

The aiming and accuracy skills of AI gunners on ships have been corrected. Excessive accuracy has been greatly reduced due to the addition of possible errors made by the gunner in assessing the speed of the target, the distance to it, and other parameters. Now, the probability of an AI gunner shooting down an aircraft stays high only if the aircraft flies head-on to the gun and does not maneuver.

So it was a bug after all, and it was finally corrected by significantly reducing the excessive accuracy. But did players really have to go through the whole process of having proper bug reports closed? Why did it take three months to fix this?

Unfortunately, the two Naval challenges appeared during that period, when the accuracy settings were broken and players had basically stopped using planes. And not a single dev noticed the issue for three months, while playing the game. How strange is that?

If anything, I think these challenges did more harm than good to Naval. It’s sad, because I feel like it was yet another missed opportunity to show players that Naval can actually be fun.

3 Likes

Graphs updated with July 2025 data:

Arcade and Realistic stats combined:

Total naval sessions as a % of AB/RB (all modes) goes from 2.6% to… drum roll please… 2.65% :) During a naval event and the biggest naval patch ever no less. RIP Leviathans?

In other news, NAB has made its big comeback, back to the same 2/3-1/3 split as we saw the spring with NRB. Sovetsky Soyuz K/D actually went UP (as did Iowa’s), Yamato and Roma still dogwater. And top tier sessions (both naval modes) went from 23,972 a day in the first 6 days of Leviathans to 12,744 a day in July, so basically a 50% player retention rate on the big BBs.

PS: really impressive work again by Statshark in getting the new data up so fast. They’ve got a Patreon if you feel like they’re giving the community a useful service here (which I do).

3 Likes

I’m sure the devs expected a much bigger increase in the number of Naval players with the release of the Leviathans update. There was an increase in June and July, but it’s really not that significant compared to the popularity of other game modes.

The funny thing is that some people actually thought Naval would become popular once iconic battleships were added to War Thunder, but the stats speak for themselves.

Yup, here is the graph:

Spoiler

It’s summer, touch a grass a bit.

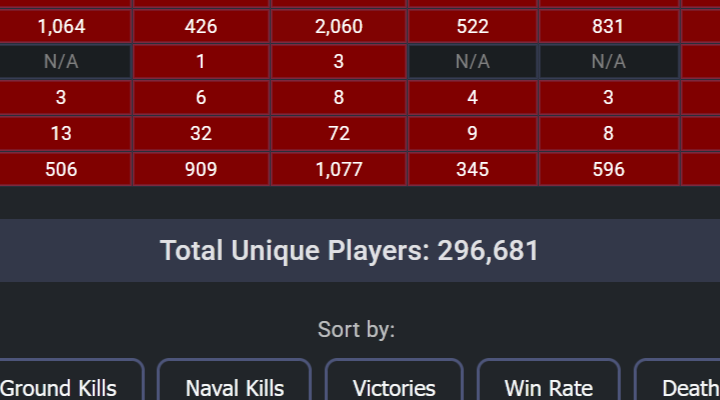
I’ve been playing around with statshark data quite a bit. I just noticed today there’s a “Total Unique Players” stat on the globalstats page. I’m not sure how accurate these totals are. For instance the “All Vehicles” total is always the same as the “Tanks” total and it doesn’t show for helicopters. There’s also the issue of where players are counted in combined arms gamemodes.

statshark_unique

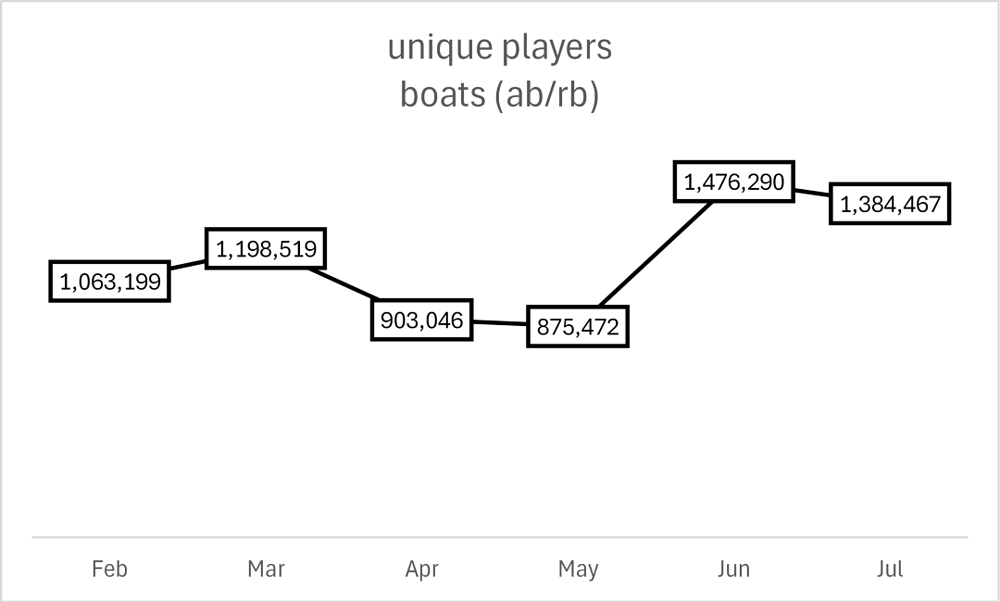
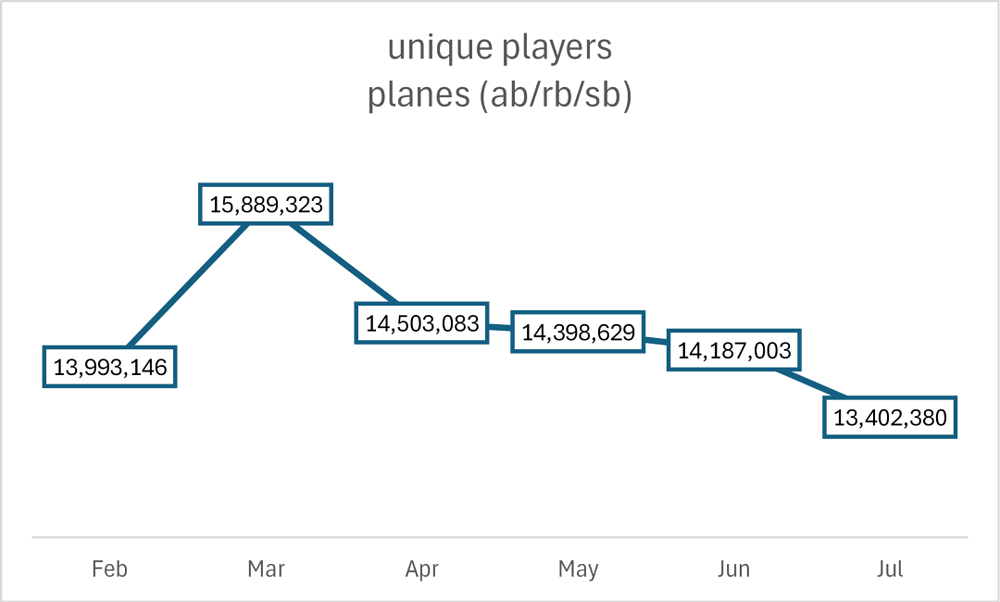
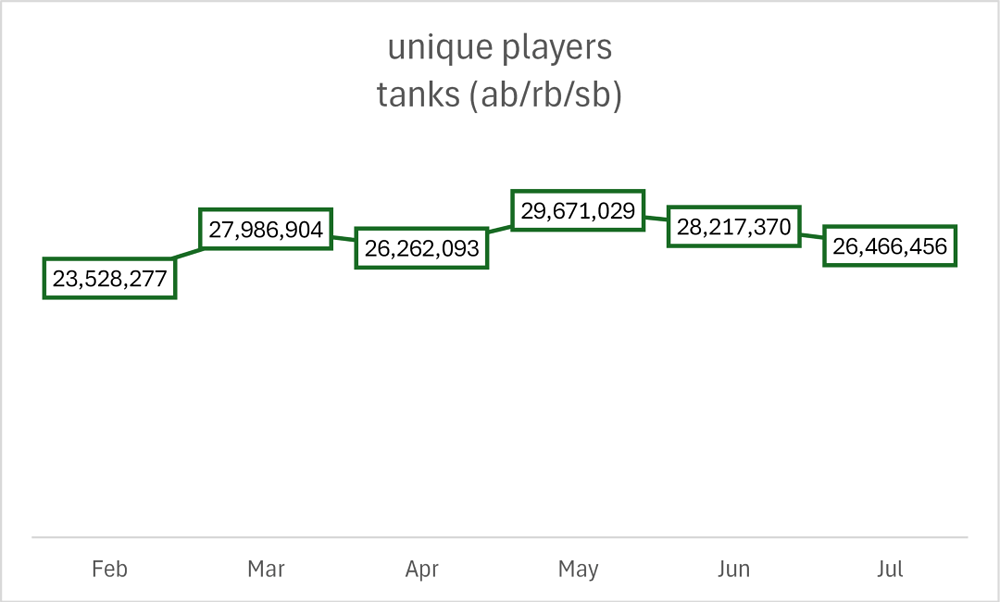
Anyways, here’s trends for all modes. There’s a nice bump for naval? While it doesn’t really make sense to add them up, naval made up 3.4% of all unique players counted in July. Ground sim tanks was only at 0.7% for July ):

Here's the table I got
date vehicle_type mode unique_players
2/1/2025 aircraft arcade 5417842
2/1/2025 tanks arcade 7052451
2/1/2025 ships arcade 700038
2/1/2025 aircraft realistic 8239146
2/1/2025 tanks realistic 16170581
2/1/2025 ships realistic 363161
2/1/2025 aircraft simulator 336158
2/1/2025 tanks simulator 305245
2/1/2025 ships simulator
3/1/2025 aircraft arcade 6201936
3/1/2025 tanks arcade 8137704
3/1/2025 ships arcade 773962
3/1/2025 aircraft realistic 9374528
3/1/2025 tanks realistic 19477607
3/1/2025 ships realistic 424557
3/1/2025 aircraft simulator 312859
3/1/2025 tanks simulator 371593
3/1/2025 ships simulator
4/1/2025 aircraft arcade 5678512
4/1/2025 tanks arcade 7606969
4/1/2025 ships arcade 577037
4/1/2025 aircraft realistic 8511122
4/1/2025 tanks realistic 18350577
4/1/2025 ships realistic 326009
4/1/2025 aircraft simulator 313449
4/1/2025 tanks simulator 304547
4/1/2025 ships simulator
5/1/2025 aircraft arcade 5521346
5/1/2025 tanks arcade 8111991
5/1/2025 ships arcade 549307
5/1/2025 aircraft realistic 8557263
5/1/2025 tanks realistic 21191702
5/1/2025 ships realistic 326165
5/1/2025 aircraft simulator 320020
5/1/2025 tanks simulator 367336
5/1/2025 ships simulator
6/1/2025 aircraft arcade 5406293
6/1/2025 tanks arcade 7600449
6/1/2025 ships arcade 859584
6/1/2025 aircraft realistic 8484758
6/1/2025 tanks realistic 20289428
6/1/2025 ships realistic 616706
6/1/2025 aircraft simulator 295952
6/1/2025 tanks simulator 327493
6/1/2025 ships simulator
7/1/2025 aircraft arcade 5105469
7/1/2025 tanks arcade 7245876
7/1/2025 ships arcade 869872
7/1/2025 aircraft realistic 8030381
7/1/2025 tanks realistic 18923899
7/1/2025 ships realistic 514595
7/1/2025 aircraft simulator 266530
7/1/2025 tanks simulator 296681
7/1/2025 ships simulator
1 Like

sir this is a game forum

Sadly, that is possibly the least useful stat on Statshark. It counts you as a “unique player” once for each match BR you played in that mode that month.

So if you’re in a session and you have one game with top BRs of 3.3, 3.0, and 2.7, you got counted as unique three times for that one session. Then if next week you played a different BR and got matches with top BR of 5.7 and 6.0, you were counted two more times.

It certainly has some level of correlation with the size of playerbases but it’s impossible to say much more than that. Adding modes together also probably leads to people playing both modes being counted twice, as well.

Sorry to be a downer… I would suggest working more with the sessional stats on the other tab.

Haha no worries, it seemed a little wonky.

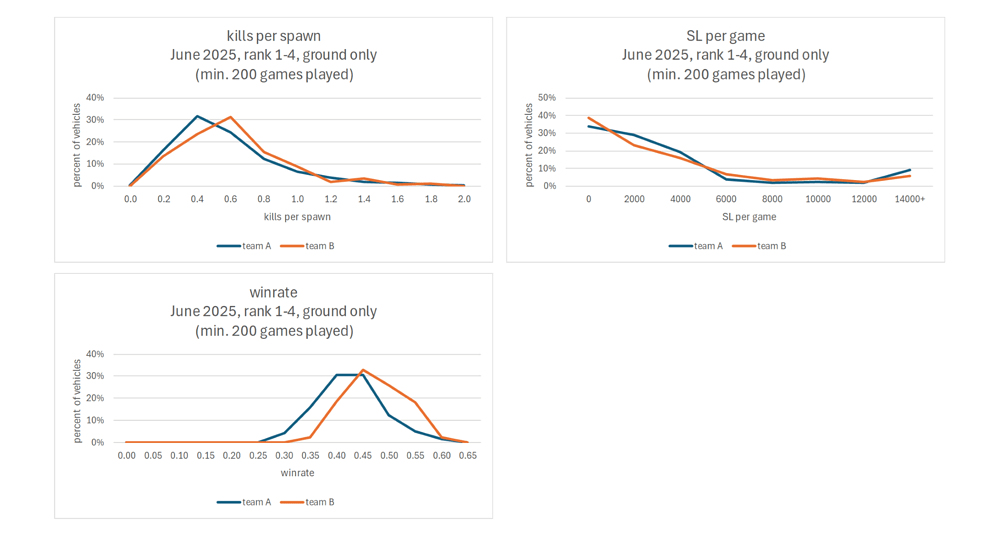
Gonna dump some stuff here. I was looking at breakdowns by vehicle classes (light, heavy, etc.) for ranks 1-4 in ground sim. In ground sim there’s set teams, set lineups, and limited spawns. It seems like a good mode to analyze with the vehicle oriented stats that statshark provides.

teams

First here’s some basics for the teams. Only June but other months look the same.

Now breaking stuff down by vehicle classes. There’s some interesting trends between teams and classes.

  • You can see the different average makeup of teams. Team A spawns more lights while team B spawns more heavies and spgs. Obviously due to the lineups but its nice validation.
  • Team A ground kills match up with spawn rates, but team B heavy and spg vehicles seem to pull much more weight in ground kills?
  • Heavies on both teams average more SL earned than other classes. Likely from taking hits and capping? This is even more impressive for team A heavies.


Kinda cool.

Here’s a question. While playing I’ve noticed in ranks 1-4 ground sim team B seems to spawn more. When team A is beaten back they seem to give up and not continue spawning, but team B often does for the comeback. Basic tables don’t reveal much I think. There’s also the plane + ground vehicle complications. Any ideas how to pin that down with statshark data?